Fig. 9
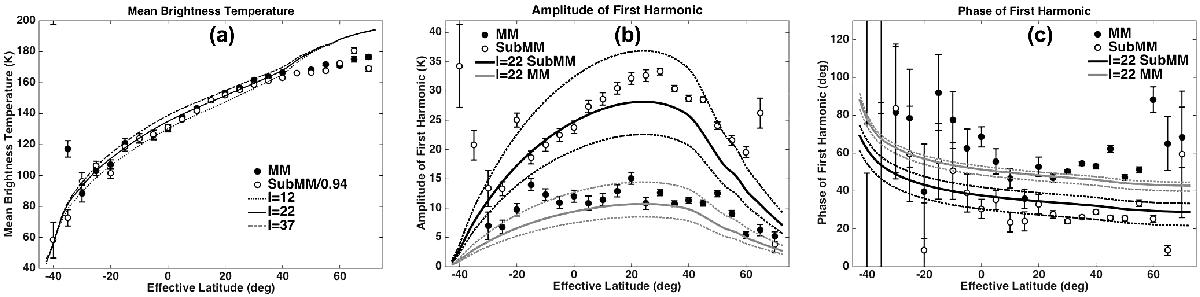
Comparison of MIRO harmonic data fit results for the submillimeter (open circles) and millimeter (filled circles) channels with thermal model closest to the best fitting thermal inertia (I = 22). Panel a) shows the mean temperature derived from the fits. Models for I = 12 and I = 37 are also shown for comparison. Panel b) shows the first harmonic amplitude. The SubMM channel model is shown as a solid black line, with dotted lines showing the range of values allowed by acceptable values of LA. The gray line shows the same results for the MM channel. Panel c) shows the phase of the first harmonic. The curves have the same meaning as in panel b).
Current usage metrics show cumulative count of Article Views (full-text article views including HTML views, PDF and ePub downloads, according to the available data) and Abstracts Views on Vision4Press platform.
Data correspond to usage on the plateform after 2015. The current usage metrics is available 48-96 hours after online publication and is updated daily on week days.
Initial download of the metrics may take a while.