Fig. 7
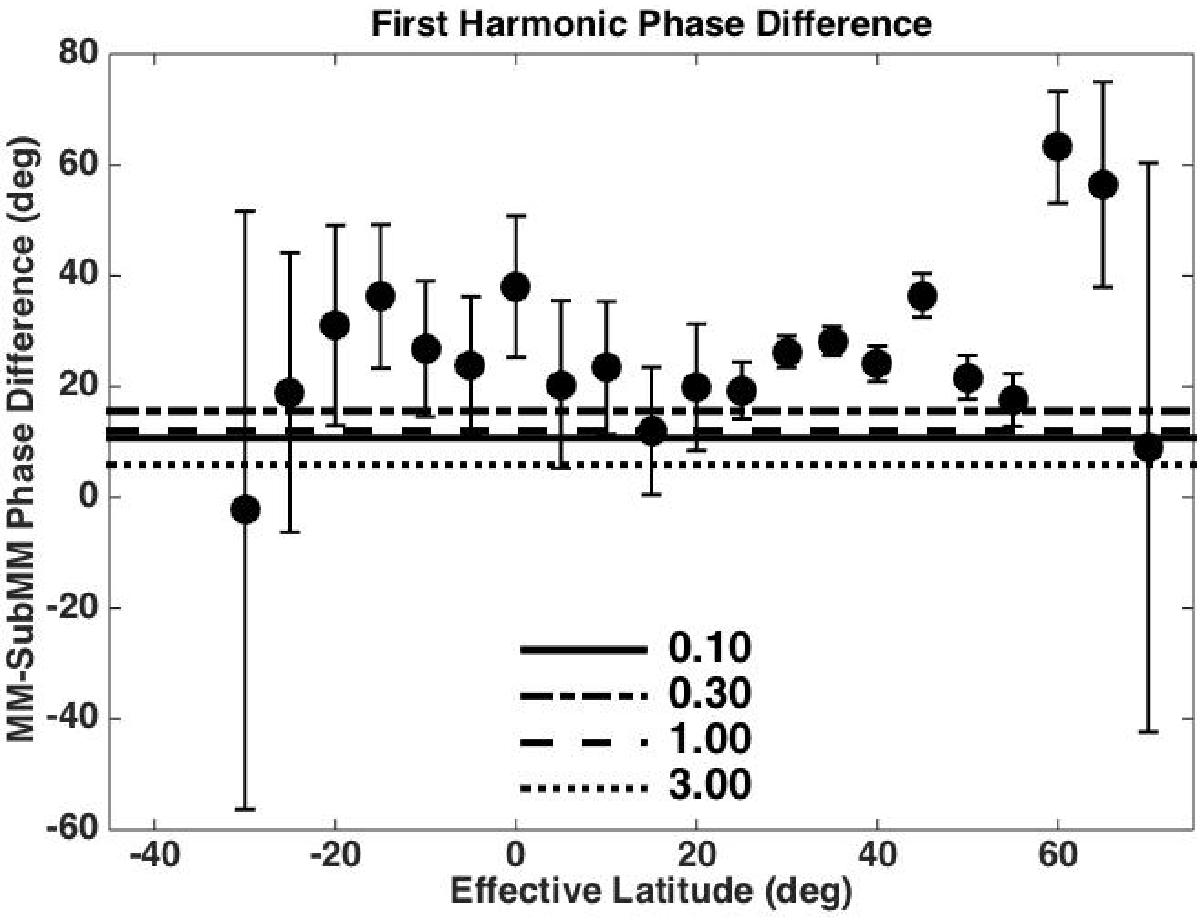
Difference between the phase of the millimeter-wave diurnal brightness temperatures and the phase of the submillimeter-wave variations. The horizontal lines show the expectations for the same set of models that were compared to the amplitude ratio data in Fig. 6. The observed phase difference is too large to be explained by the simple model.
Current usage metrics show cumulative count of Article Views (full-text article views including HTML views, PDF and ePub downloads, according to the available data) and Abstracts Views on Vision4Press platform.
Data correspond to usage on the plateform after 2015. The current usage metrics is available 48-96 hours after online publication and is updated daily on week days.
Initial download of the metrics may take a while.