Fig. 4
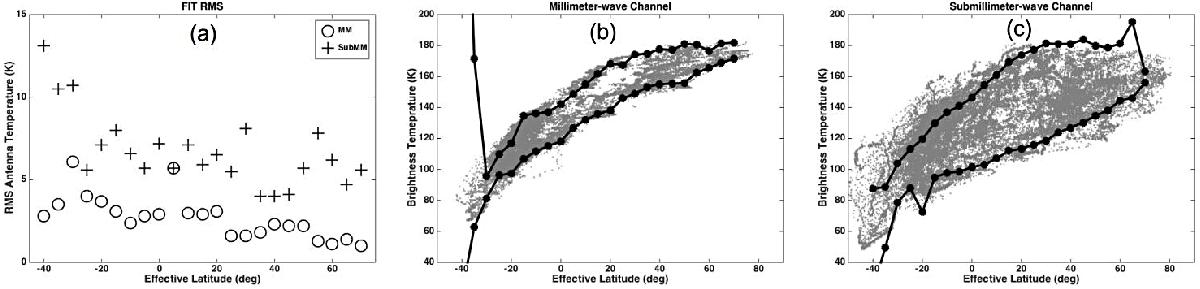
MIRO harmonic data fits compared to the brightness temperature data. Panel a) shows the rms of the fits to each latitude bin. The MM rms is typically 2–3 K while the SubMM rms is typically 7–8 K. These values are significantly greater than would be expected from measurement errors alone, indicating some real, unmodeled, variations in the dataset. Panel b) shows all MM brightness temperatures compared to lines representing the mean model temperature plus the first harmonic amplitude and the mean minus the first harmonic amplitude. Panel c) shows the same information for the SubMM channel.
Current usage metrics show cumulative count of Article Views (full-text article views including HTML views, PDF and ePub downloads, according to the available data) and Abstracts Views on Vision4Press platform.
Data correspond to usage on the plateform after 2015. The current usage metrics is available 48-96 hours after online publication and is updated daily on week days.
Initial download of the metrics may take a while.