Fig. 3
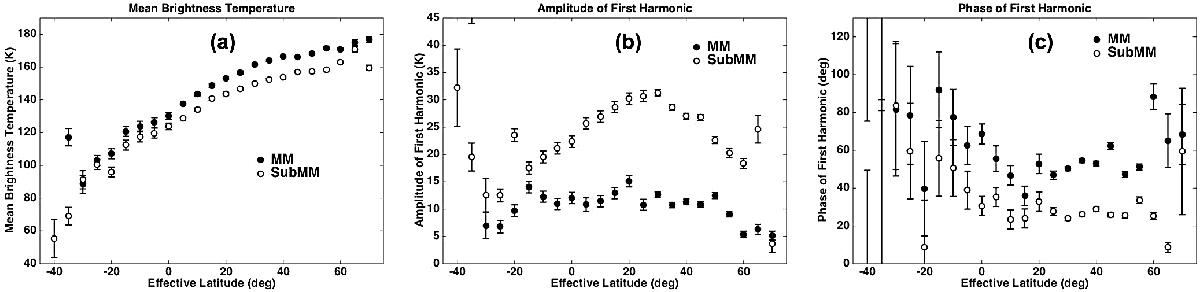
MIRO harmonic data fit results for the SubMM (open circles) and MM (filled circles) channels. The points are plotted with formal error bars shown as well. Often, since the formal errors are small, the errorbars do not extend beyond the point symbols. Panel a) shows the mean brightness temperature derived from the fits. Panel b) shows the first harmonic amplitude of the brightness temperature variation. Panel c) shows the phase of the first harmonic of the brightness temperature variation.
Current usage metrics show cumulative count of Article Views (full-text article views including HTML views, PDF and ePub downloads, according to the available data) and Abstracts Views on Vision4Press platform.
Data correspond to usage on the plateform after 2015. The current usage metrics is available 48-96 hours after online publication and is updated daily on week days.
Initial download of the metrics may take a while.