Fig. 1
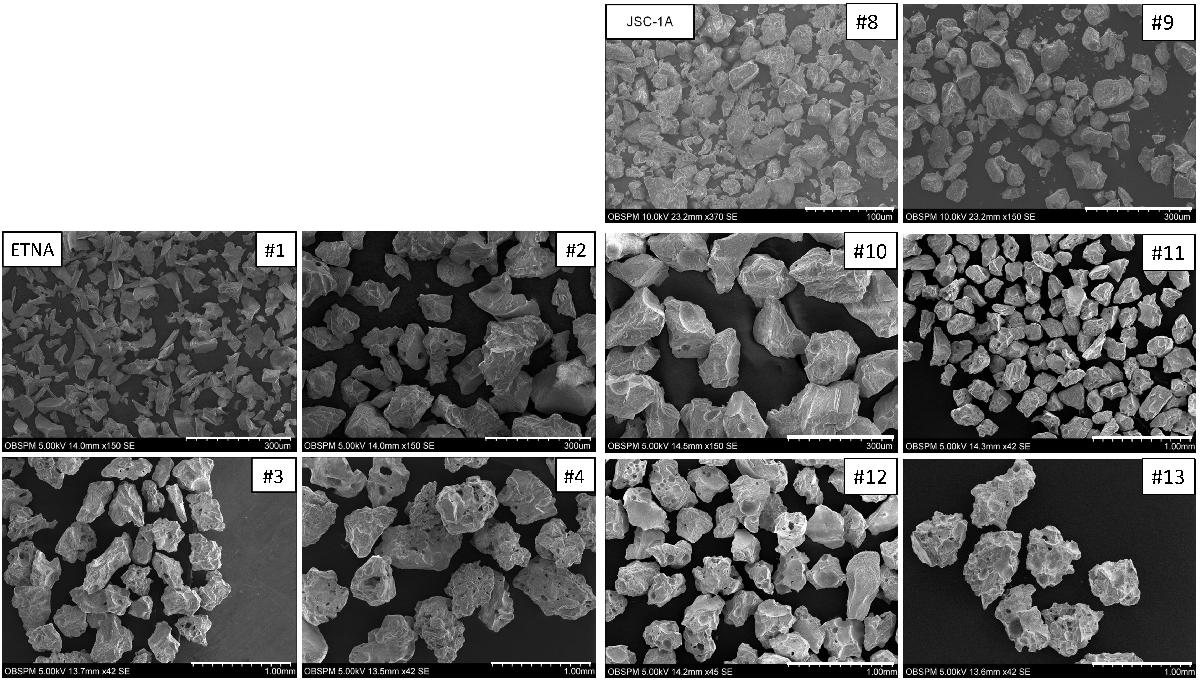
Scanning electron microscope images of Etna subsamples (#1, #2, #3, and #4) and JSC-1A Lunar regolith simulant subsamples (#8, #9, #10, #11, #12, and #13), with sizes of about a few to 500 μm. Different scales are used to show as best possible both the grain size distribution and the high intrinsic porosity of individual grains. The white line in the bottom right corner of each image provides the scale, equal to 100 μm (#8), 300 μm (#1, #2, #9, and #10), and 1 mm (#3, #4, #11, #12, and #13).
Current usage metrics show cumulative count of Article Views (full-text article views including HTML views, PDF and ePub downloads, according to the available data) and Abstracts Views on Vision4Press platform.
Data correspond to usage on the plateform after 2015. The current usage metrics is available 48-96 hours after online publication and is updated daily on week days.
Initial download of the metrics may take a while.