Fig. 7
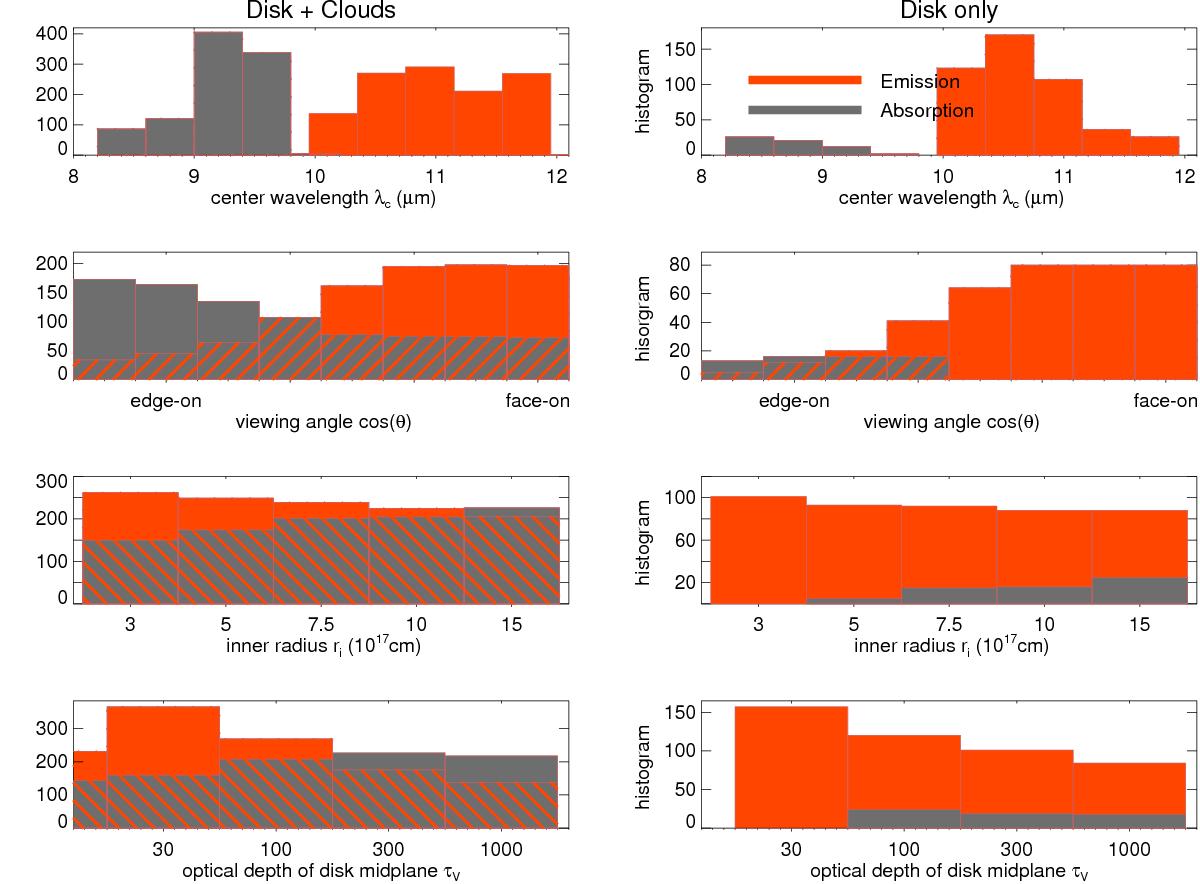
Histograms of the silicate emission (red) and absorption (gray) band for the AGN library labeled “Disk+Clouds” (left) and disk-only models (right). Distribution functions are shown from top to bottom for the central wavelength of the feature, the viewing angle, the inner radius of the AGN dust torus, and the optical depth along the midplane of the homogeneous disk.
Current usage metrics show cumulative count of Article Views (full-text article views including HTML views, PDF and ePub downloads, according to the available data) and Abstracts Views on Vision4Press platform.
Data correspond to usage on the plateform after 2015. The current usage metrics is available 48-96 hours after online publication and is updated daily on week days.
Initial download of the metrics may take a while.