Free Access
Fig. 14
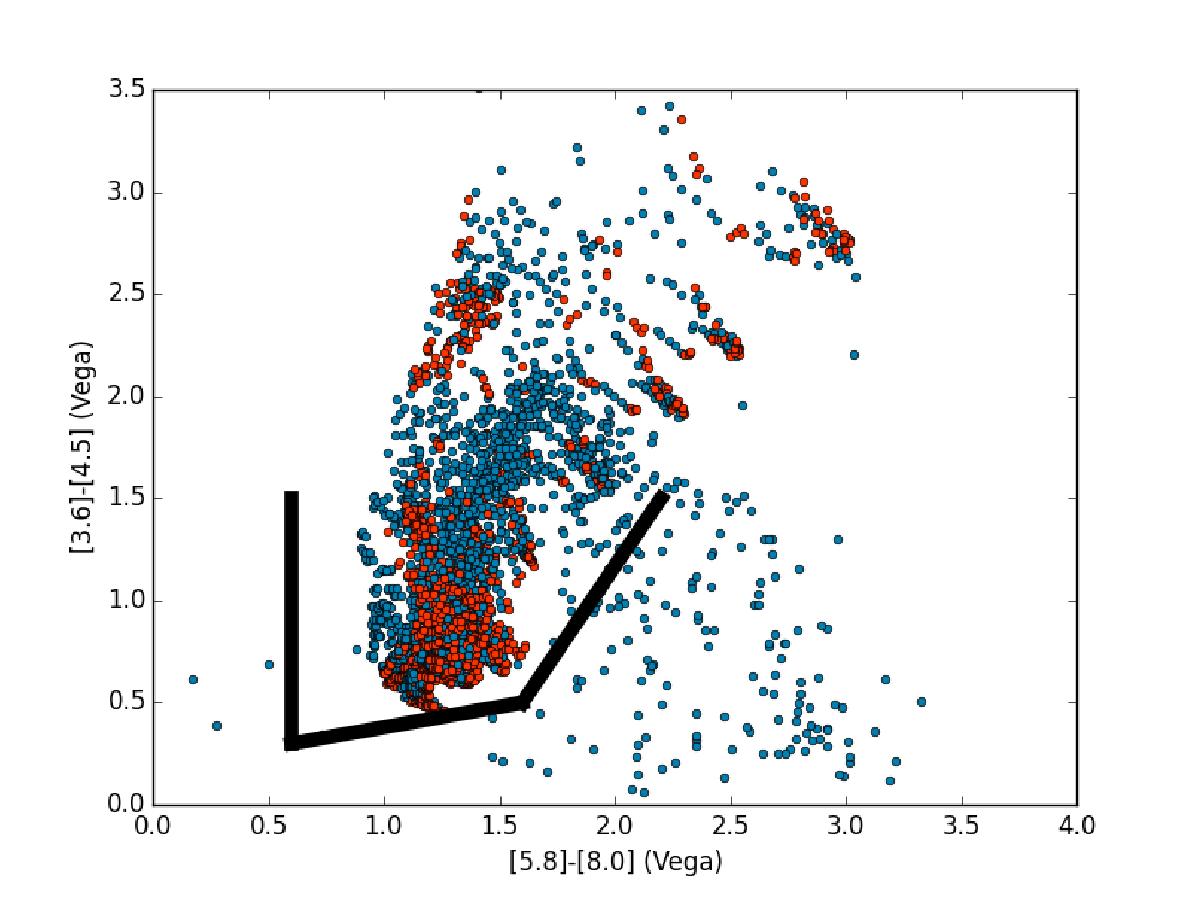
Spitzer/IRAC mid-IR color diagram. Observed AGNs populate the area in between the black lines at [3.6] − [4.5] ≳ 0.3 (Stern et al. 2005). Colors derived from the AGN library populate this area. Type I sources with viewing angle <60° are shown as red circles and over-plotted are type II sources (> 60°) as blue circles .
Current usage metrics show cumulative count of Article Views (full-text article views including HTML views, PDF and ePub downloads, according to the available data) and Abstracts Views on Vision4Press platform.
Data correspond to usage on the plateform after 2015. The current usage metrics is available 48-96 hours after online publication and is updated daily on week days.
Initial download of the metrics may take a while.