Free Access
Fig. 7
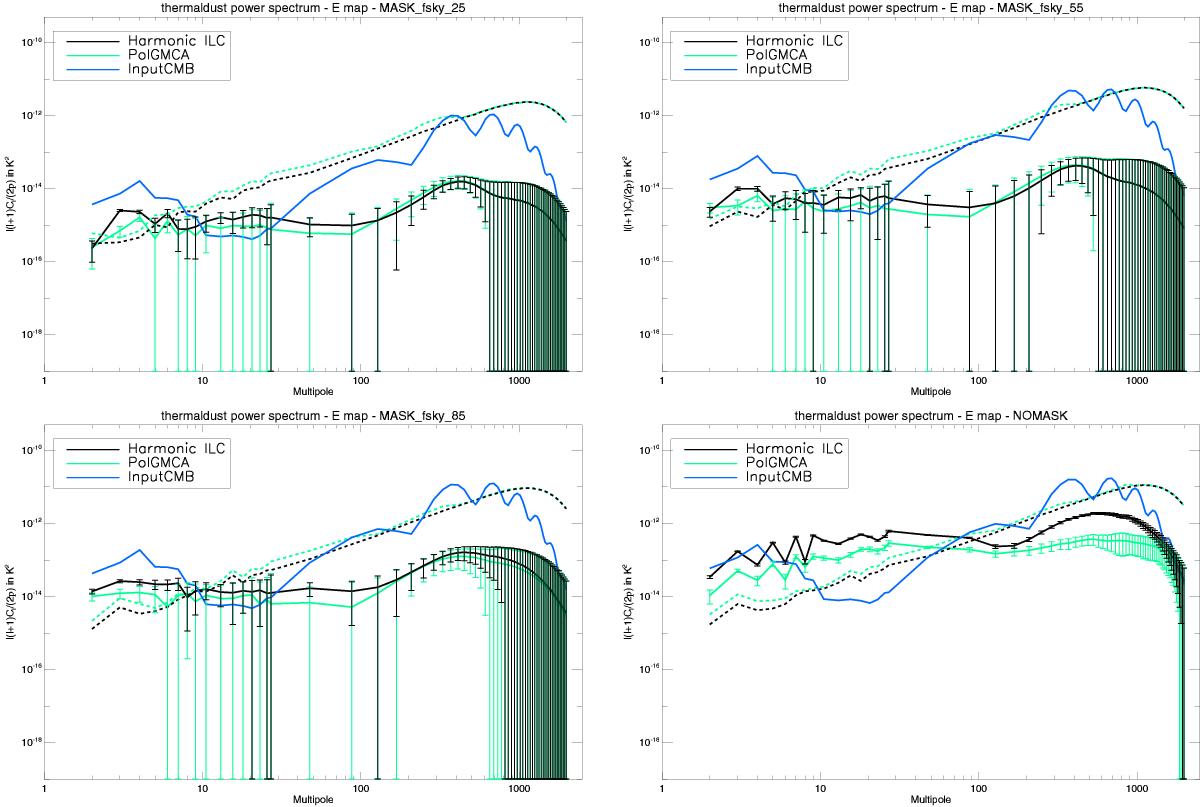
Thermal dust – top left panel: power spectrum of the thermal dust residual in the estimated E map from a sky coverage of 25%. Top right panel: the same from a sky coverage of 55%. Bottom left panel: the same from a sky coverage of 85%. Bottom right panel: the same for the full sky.
Current usage metrics show cumulative count of Article Views (full-text article views including HTML views, PDF and ePub downloads, according to the available data) and Abstracts Views on Vision4Press platform.
Data correspond to usage on the plateform after 2015. The current usage metrics is available 48-96 hours after online publication and is updated daily on week days.
Initial download of the metrics may take a while.