Fig. 4
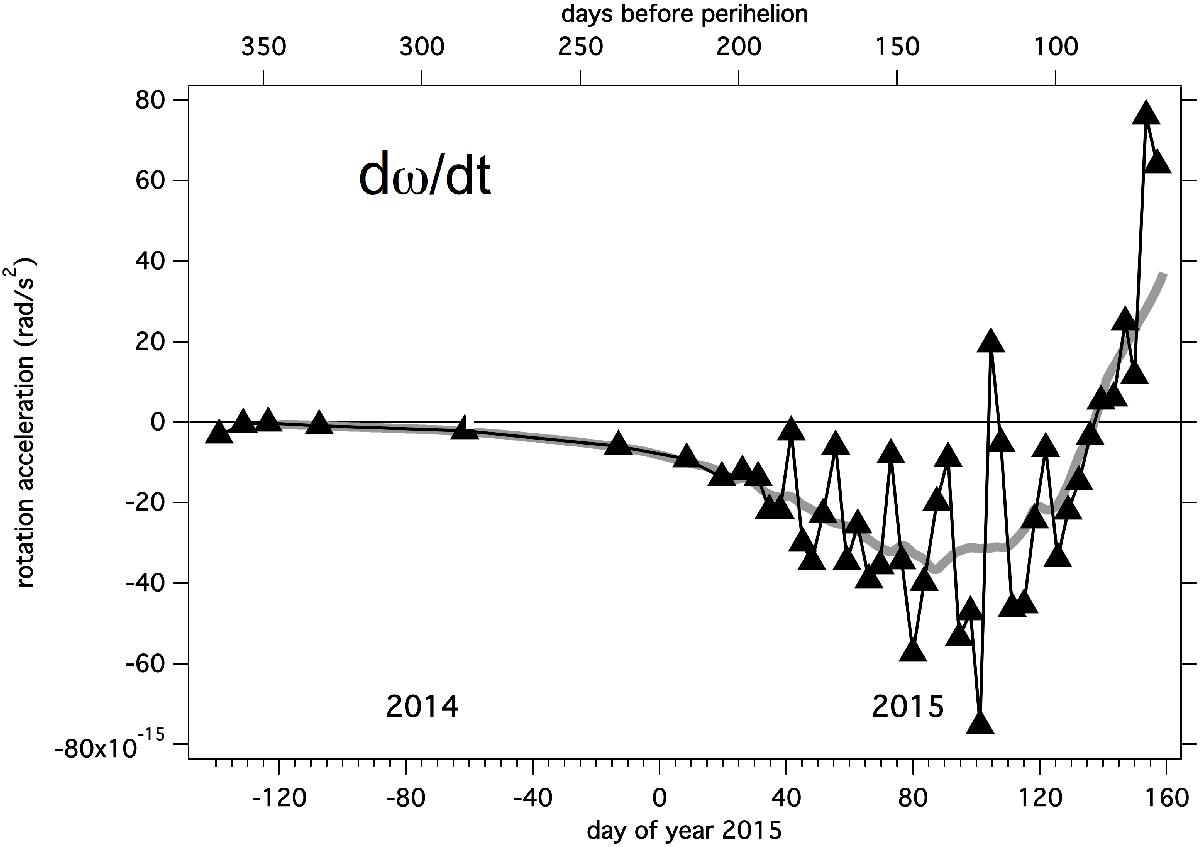
Black triangles: deceleration of the spin rate since rendezvous with comet 67 P as a function of time from August 2014 to 6 May 2015. Bottom scale: day of year 2015. Top scale: days before 2015 perihelion. They were time-derived from ESOC data of Fig. 2, obtained by the ESOC navigation team from the fit of observed landmarks with a shape model and an assumed constant spin rate over a period of a few days. The strong oscillations with a period of 16 days are most likely not real and linked to the simplifying assumption of no precession (see text). The thick gray line is a smoothed average over 32 days. It shows that the spin rate change went through a minimum around April 10 and changed sign around mid-May 2015, a sign of outgassing pattern change linked to the solar illumination geometry change, passing to more southern latitudes.
Current usage metrics show cumulative count of Article Views (full-text article views including HTML views, PDF and ePub downloads, according to the available data) and Abstracts Views on Vision4Press platform.
Data correspond to usage on the plateform after 2015. The current usage metrics is available 48-96 hours after online publication and is updated daily on week days.
Initial download of the metrics may take a while.