Fig. 1
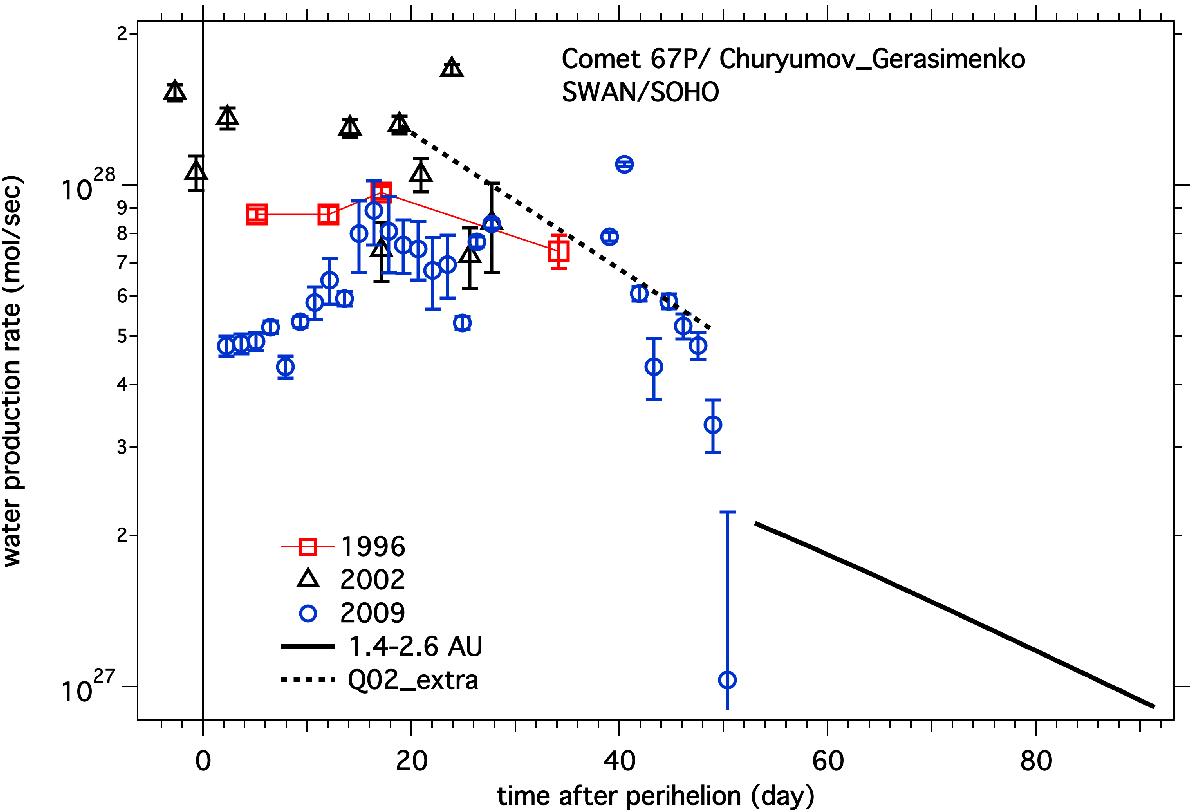
Water production rates in comet 67P/Churyumov-Gerasimenko. They are derived from Lyman-α single-images collected by SWAN/SOHO at three last perihelion passages in 1996, 2002, and 2009. The error bars show the formal error resulting from instrument noise and model fitting. The error bars do not include a 30% systematic uncertainty. The change in the level of the production rate near perihelion from 1996 to 2009 is remarkable. However, the activity levels are more similar by 25 days after perihelion. These data are taken from Bertaux et al. (2014). The dashed line is an interpolation between a 2002 point at 18 days after perihelion and a 2009 point at 45 days after perihelion to complement the 2002 SWAN measurements after the last point at 28 days. The solid line is an interpolation between a point at 1.4 AU suggested by SWAN values in 2009 and the Rosina/COPS estimate at 2.6 AU.
Current usage metrics show cumulative count of Article Views (full-text article views including HTML views, PDF and ePub downloads, according to the available data) and Abstracts Views on Vision4Press platform.
Data correspond to usage on the plateform after 2015. The current usage metrics is available 48-96 hours after online publication and is updated daily on week days.
Initial download of the metrics may take a while.