Fig. 5
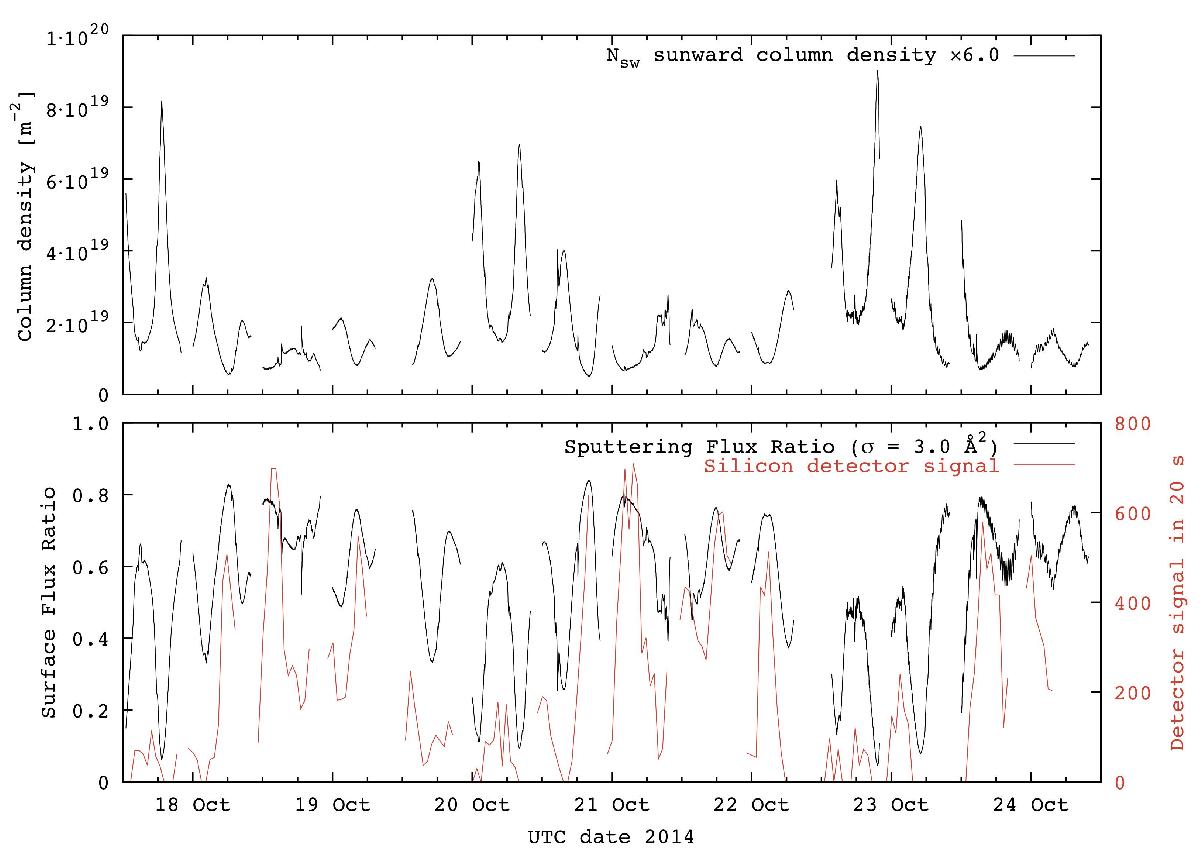
Top panel: column density Nsw derived from COPS density measurements (using Eq. (4)), adjusted to the direction of solar wind flow. Bottom panel: calculated flux ratio for solar wind particles that reach the cometary surface and sputtered atoms back to the ROSINA observation point (black lines), using Eq. (5). The sputtered Si signal is shown as red lines. Interruptions in the lines were caused at times when the sensors were turned off.
Current usage metrics show cumulative count of Article Views (full-text article views including HTML views, PDF and ePub downloads, according to the available data) and Abstracts Views on Vision4Press platform.
Data correspond to usage on the plateform after 2015. The current usage metrics is available 48-96 hours after online publication and is updated daily on week days.
Initial download of the metrics may take a while.