Open Access
Fig. 3
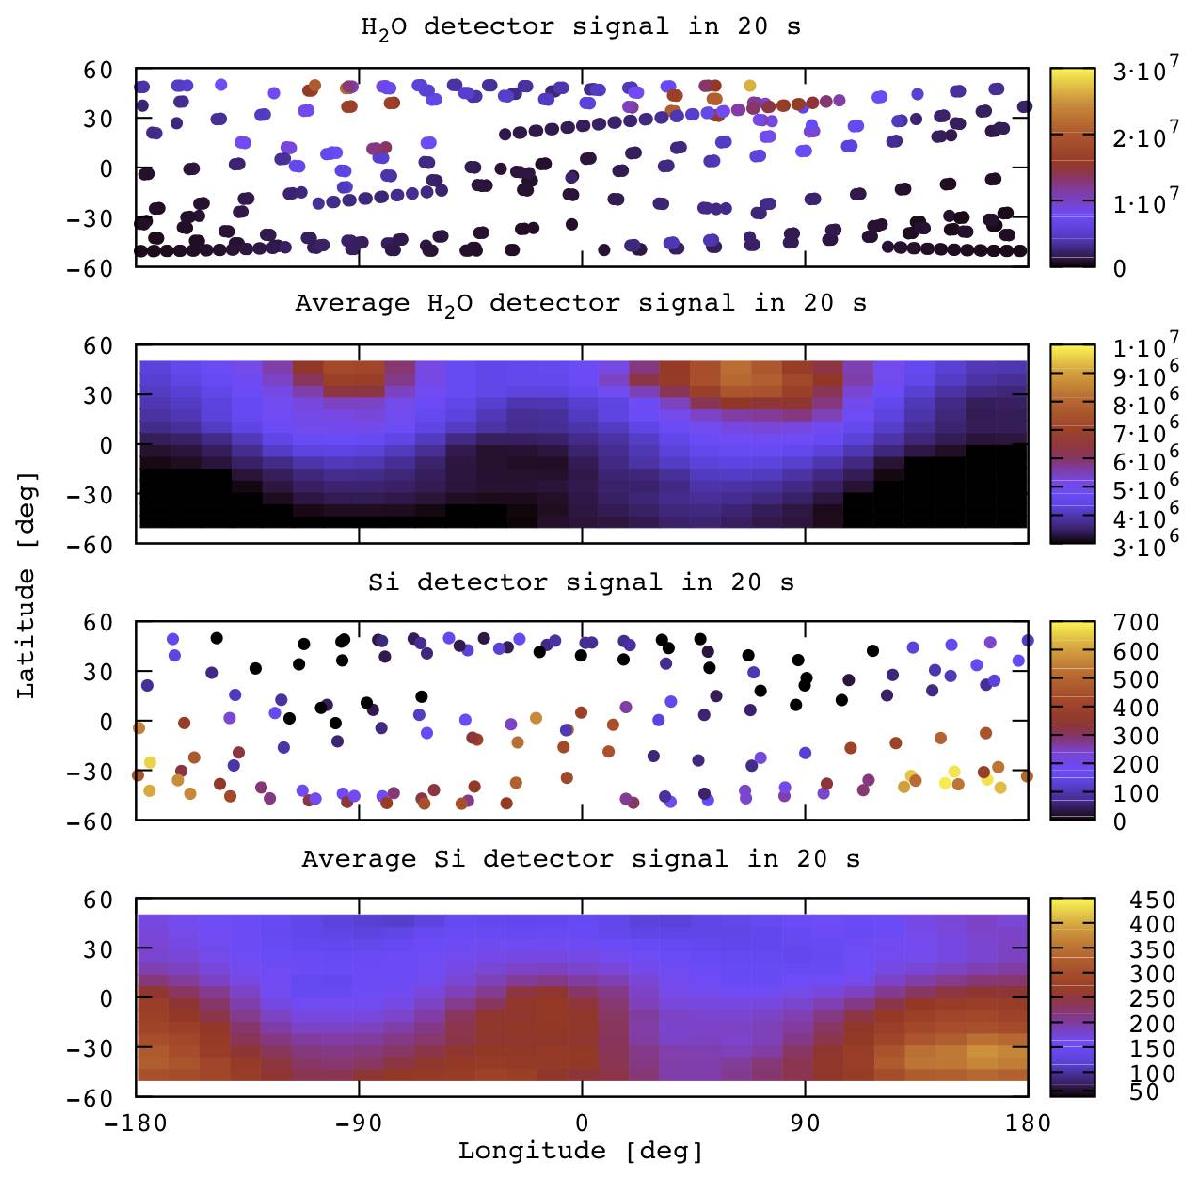
Maps for the H2O (top two panels) and the Si signal (bottom two panels) measured with DFMS. Top panel and third panel from the top: actual measurements, normalized onto a 10 km sphere around the nucleus. Other two panels: interpolation of these signals to a complete map.
Current usage metrics show cumulative count of Article Views (full-text article views including HTML views, PDF and ePub downloads, according to the available data) and Abstracts Views on Vision4Press platform.
Data correspond to usage on the plateform after 2015. The current usage metrics is available 48-96 hours after online publication and is updated daily on week days.
Initial download of the metrics may take a while.