Fig. 2
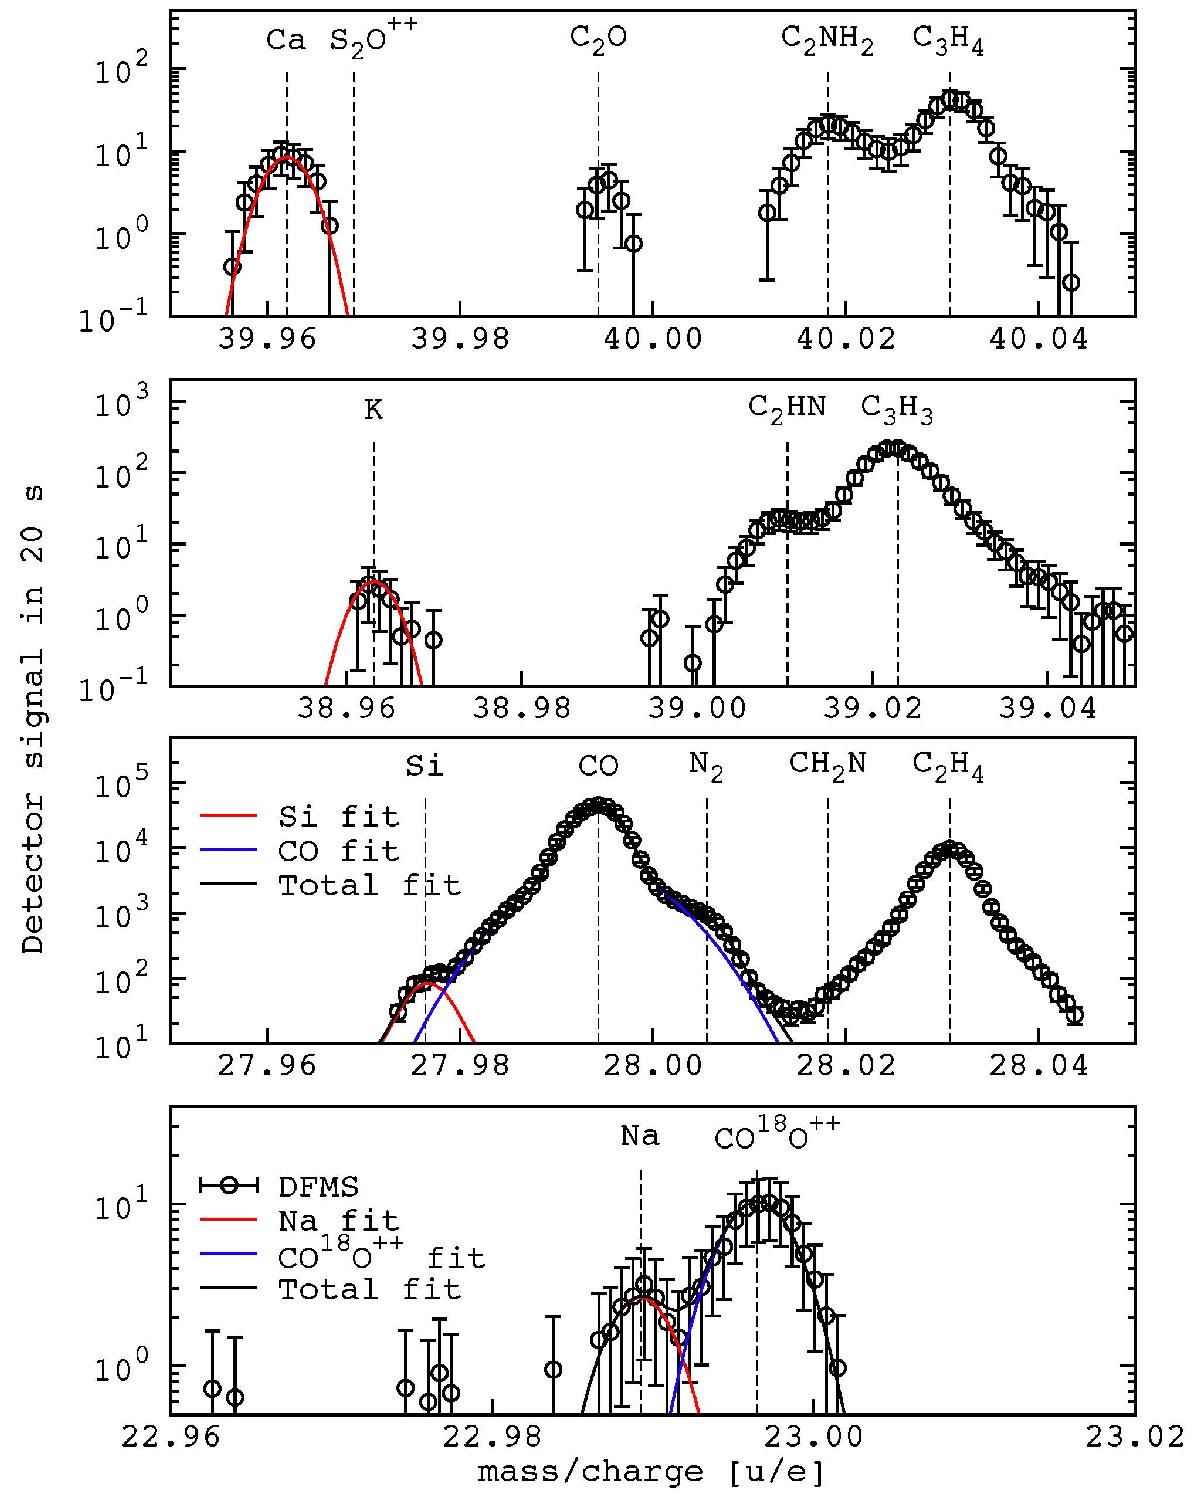
High-resolution mass spectra from DFMS/ROSINA for the species Ca, K, Si and Na, which are observed together with other species from the volatile material of the coma. Red lines represent Gaussian fits to the mass peaks of interest, blue lines to mass peaks that are close to the mass peak of interest, and the black lines are the sum curve.
Current usage metrics show cumulative count of Article Views (full-text article views including HTML views, PDF and ePub downloads, according to the available data) and Abstracts Views on Vision4Press platform.
Data correspond to usage on the plateform after 2015. The current usage metrics is available 48-96 hours after online publication and is updated daily on week days.
Initial download of the metrics may take a while.