Fig. 2
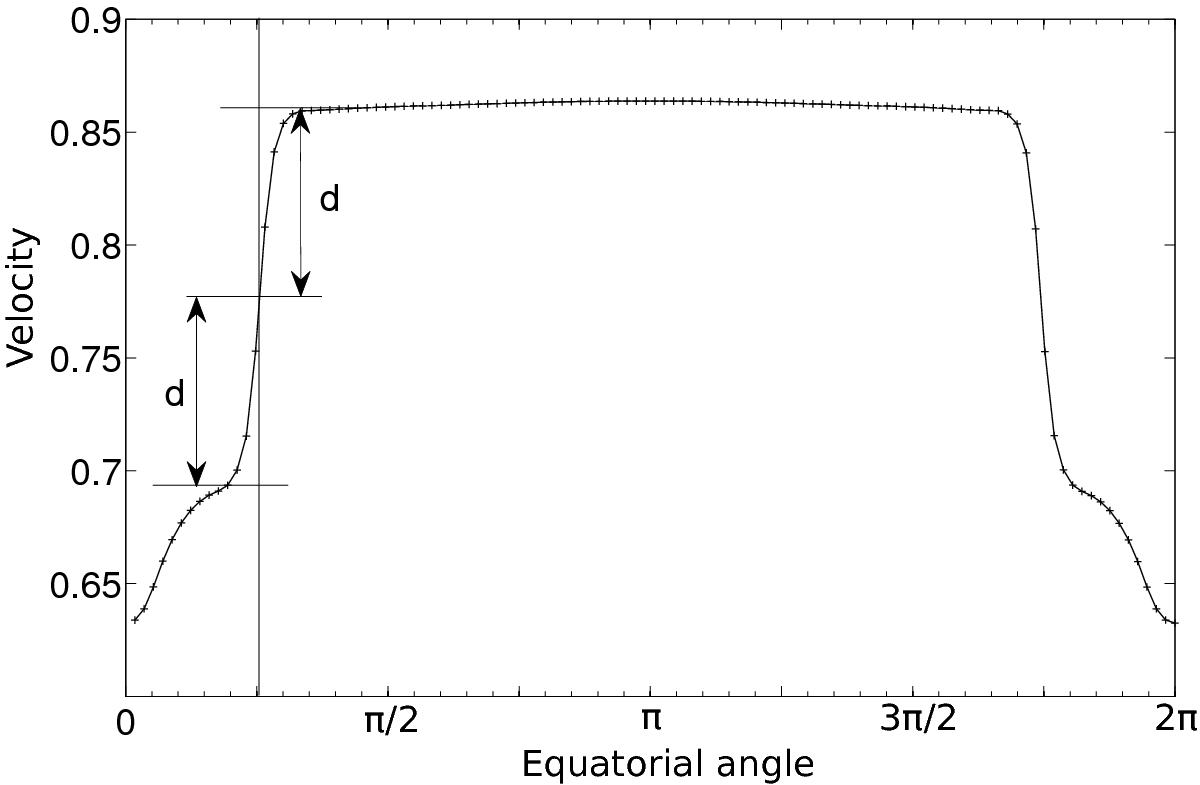
Velocity against equatorial angle measured at radius r = 30M for model UB1. This shows how we calculate the shock angle. The upper and lower horizontal lines on the left of the plot mark the upper and lower bounds of the shock, the central horizontal line is midway between these, and the shock location is taken to be where this crosses the numerical solution, at θ ≈ π/ 4 in this case.
Current usage metrics show cumulative count of Article Views (full-text article views including HTML views, PDF and ePub downloads, according to the available data) and Abstracts Views on Vision4Press platform.
Data correspond to usage on the plateform after 2015. The current usage metrics is available 48-96 hours after online publication and is updated daily on week days.
Initial download of the metrics may take a while.