Fig. 4
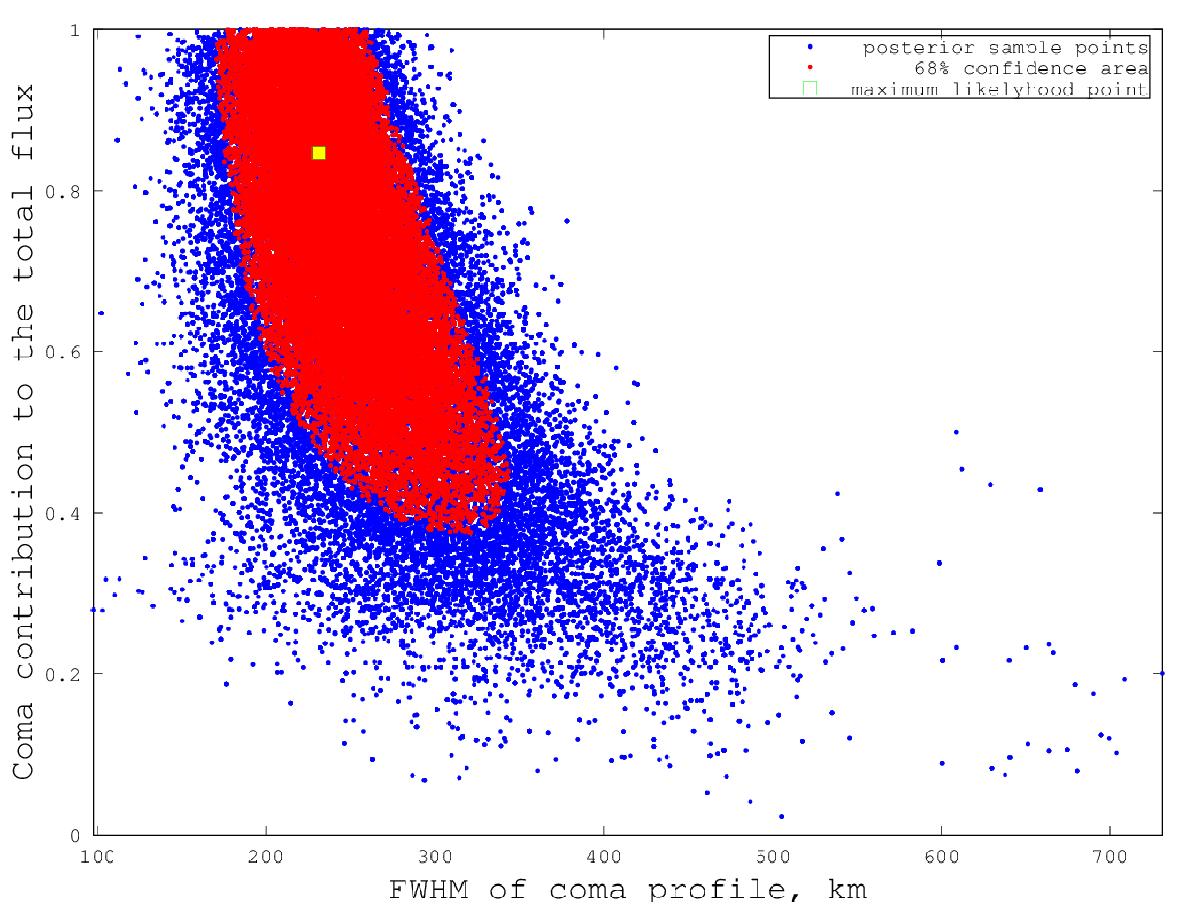
Posterior distribution of the exponential model fitting the coma on 21 August 2014 R-band observations. The red area indicates the 68% confidence limits, and the yellow square in the center is a maximum likelihood point corresponding to a coma contribution of 85% to the overall brightness and the FWHM of the coma profile at about the 240 km distance. The result is in some sense degenerated: the brighter coma implies more compact distribution, while the fainter coma is connected with its larger spatial size.
Current usage metrics show cumulative count of Article Views (full-text article views including HTML views, PDF and ePub downloads, according to the available data) and Abstracts Views on Vision4Press platform.
Data correspond to usage on the plateform after 2015. The current usage metrics is available 48-96 hours after online publication and is updated daily on week days.
Initial download of the metrics may take a while.