Fig. 4
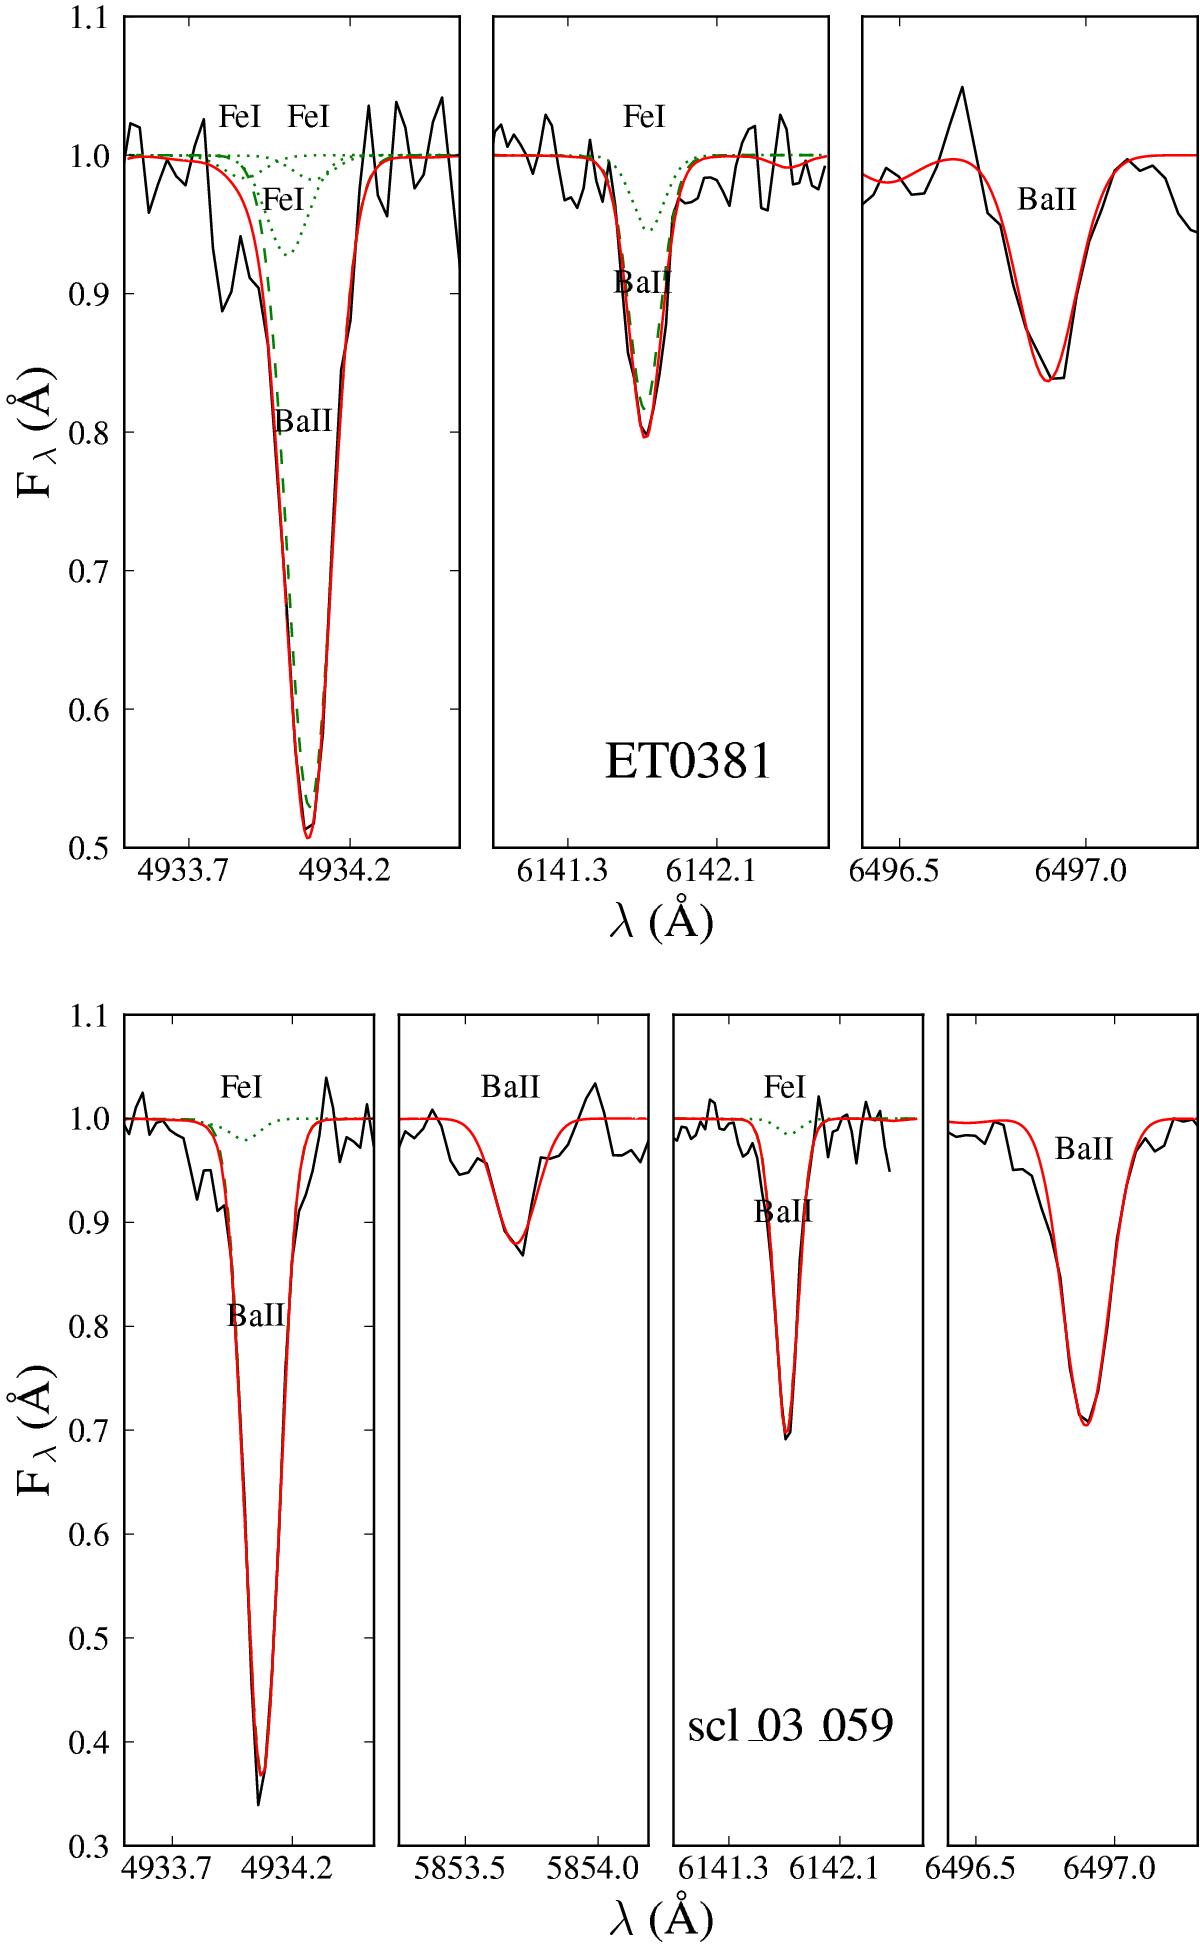
Synthesis of the Ba lines for ET0381 (upper panel) and scl_03_059 (lower panel). A value of fodd = 0.18 is taken for the Ba ii 4934 Å. The observed spectra are shown in black. The red continuous, green dashed, and green dotted curves correspond to the theoretical spectra of the full blend, pure Ba ii lines, and Fe i blending lines, respectively.
Current usage metrics show cumulative count of Article Views (full-text article views including HTML views, PDF and ePub downloads, according to the available data) and Abstracts Views on Vision4Press platform.
Data correspond to usage on the plateform after 2015. The current usage metrics is available 48-96 hours after online publication and is updated daily on week days.
Initial download of the metrics may take a while.