Fig. 3
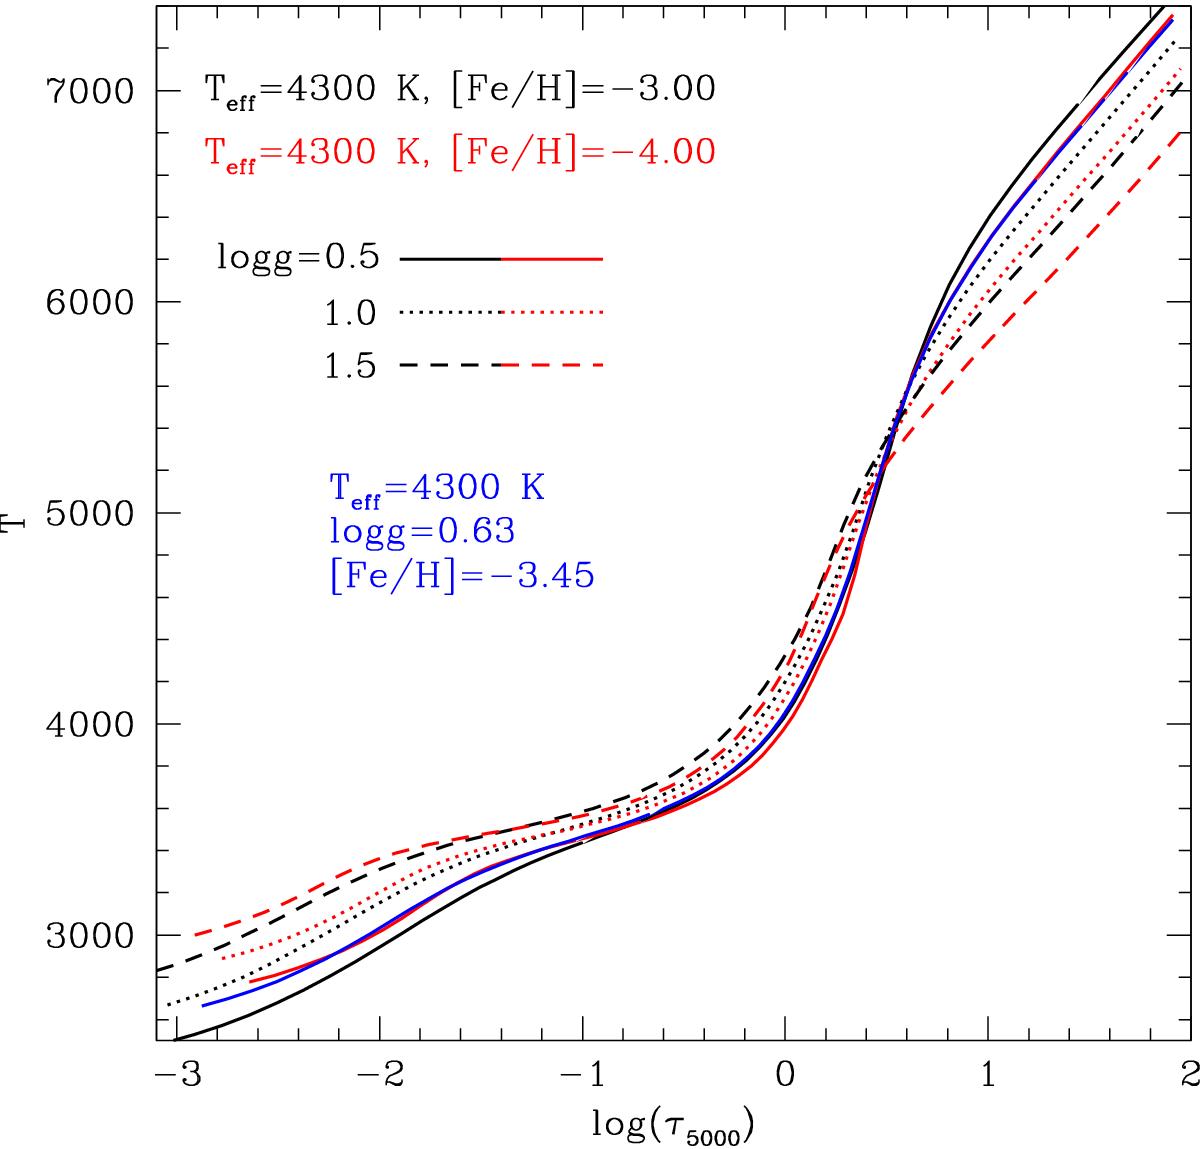
Teff – log(τ) relation for the extrapolated model of scl002_06 (blue), compared with grid models for [Fe/H] = −3.0 (black) and −4.0 (red), and log g= 0.5,1.0,1.5, for Teff = 4300 K. All these models are interpolated in Teff between 4250 and 4500 K, but those with log g< 1.0 and [Fe/H] = −4.0 are interpolated between eight models (4250,4500;0.5,1.0;−4.0,−3.0), two of which are extrapolated (4250,4500;0.5;−4.0) from the MARCS grid. By chance, the model interpolated for scl002_06 (full blue curve) almost exactly coincides with the (4300;0.5;−4.0) model (full red curve), except in the range −0.5 < log(τ5000< + 0.4.
Current usage metrics show cumulative count of Article Views (full-text article views including HTML views, PDF and ePub downloads, according to the available data) and Abstracts Views on Vision4Press platform.
Data correspond to usage on the plateform after 2015. The current usage metrics is available 48-96 hours after online publication and is updated daily on week days.
Initial download of the metrics may take a while.