Fig. 1
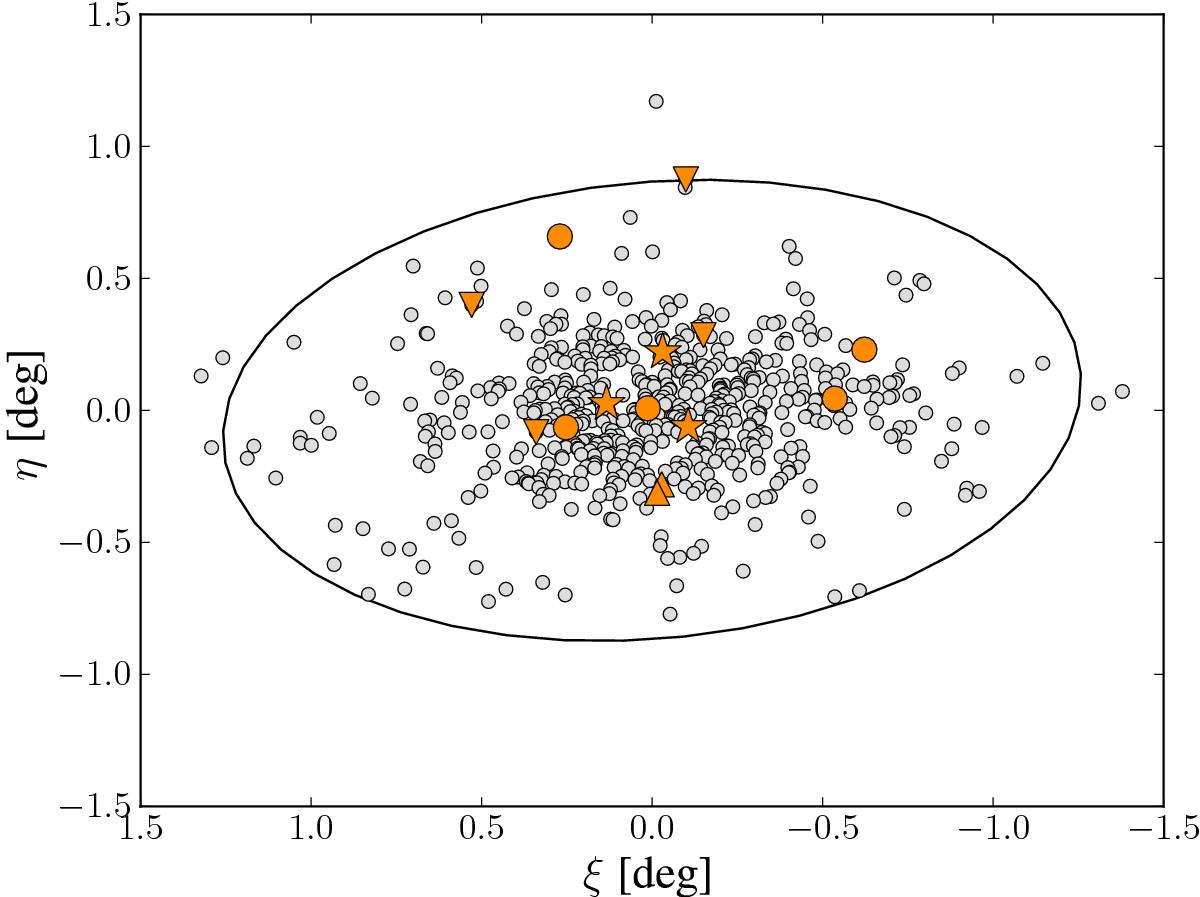
Spatial distribution of the EMPS analyzed in this paper. The grey circles show the Sculptor member stars from the CaT analysis from Battaglia et al. (2008a). The orange circles indicate our new sample of stars with chemical abundances derived from high-resolution spectroscopy. The star symbols identify the EMPS of Frebel et al. (2010a) and Simon et al. (2015), while the upright triangles points to the sample of Tafelmeyer et al. (2010) and inverted triangles the EMPS of Starkenburg et al. (2013), which have not been reanalyzed at high resolution.
Current usage metrics show cumulative count of Article Views (full-text article views including HTML views, PDF and ePub downloads, according to the available data) and Abstracts Views on Vision4Press platform.
Data correspond to usage on the plateform after 2015. The current usage metrics is available 48-96 hours after online publication and is updated daily on week days.
Initial download of the metrics may take a while.