Fig. 7
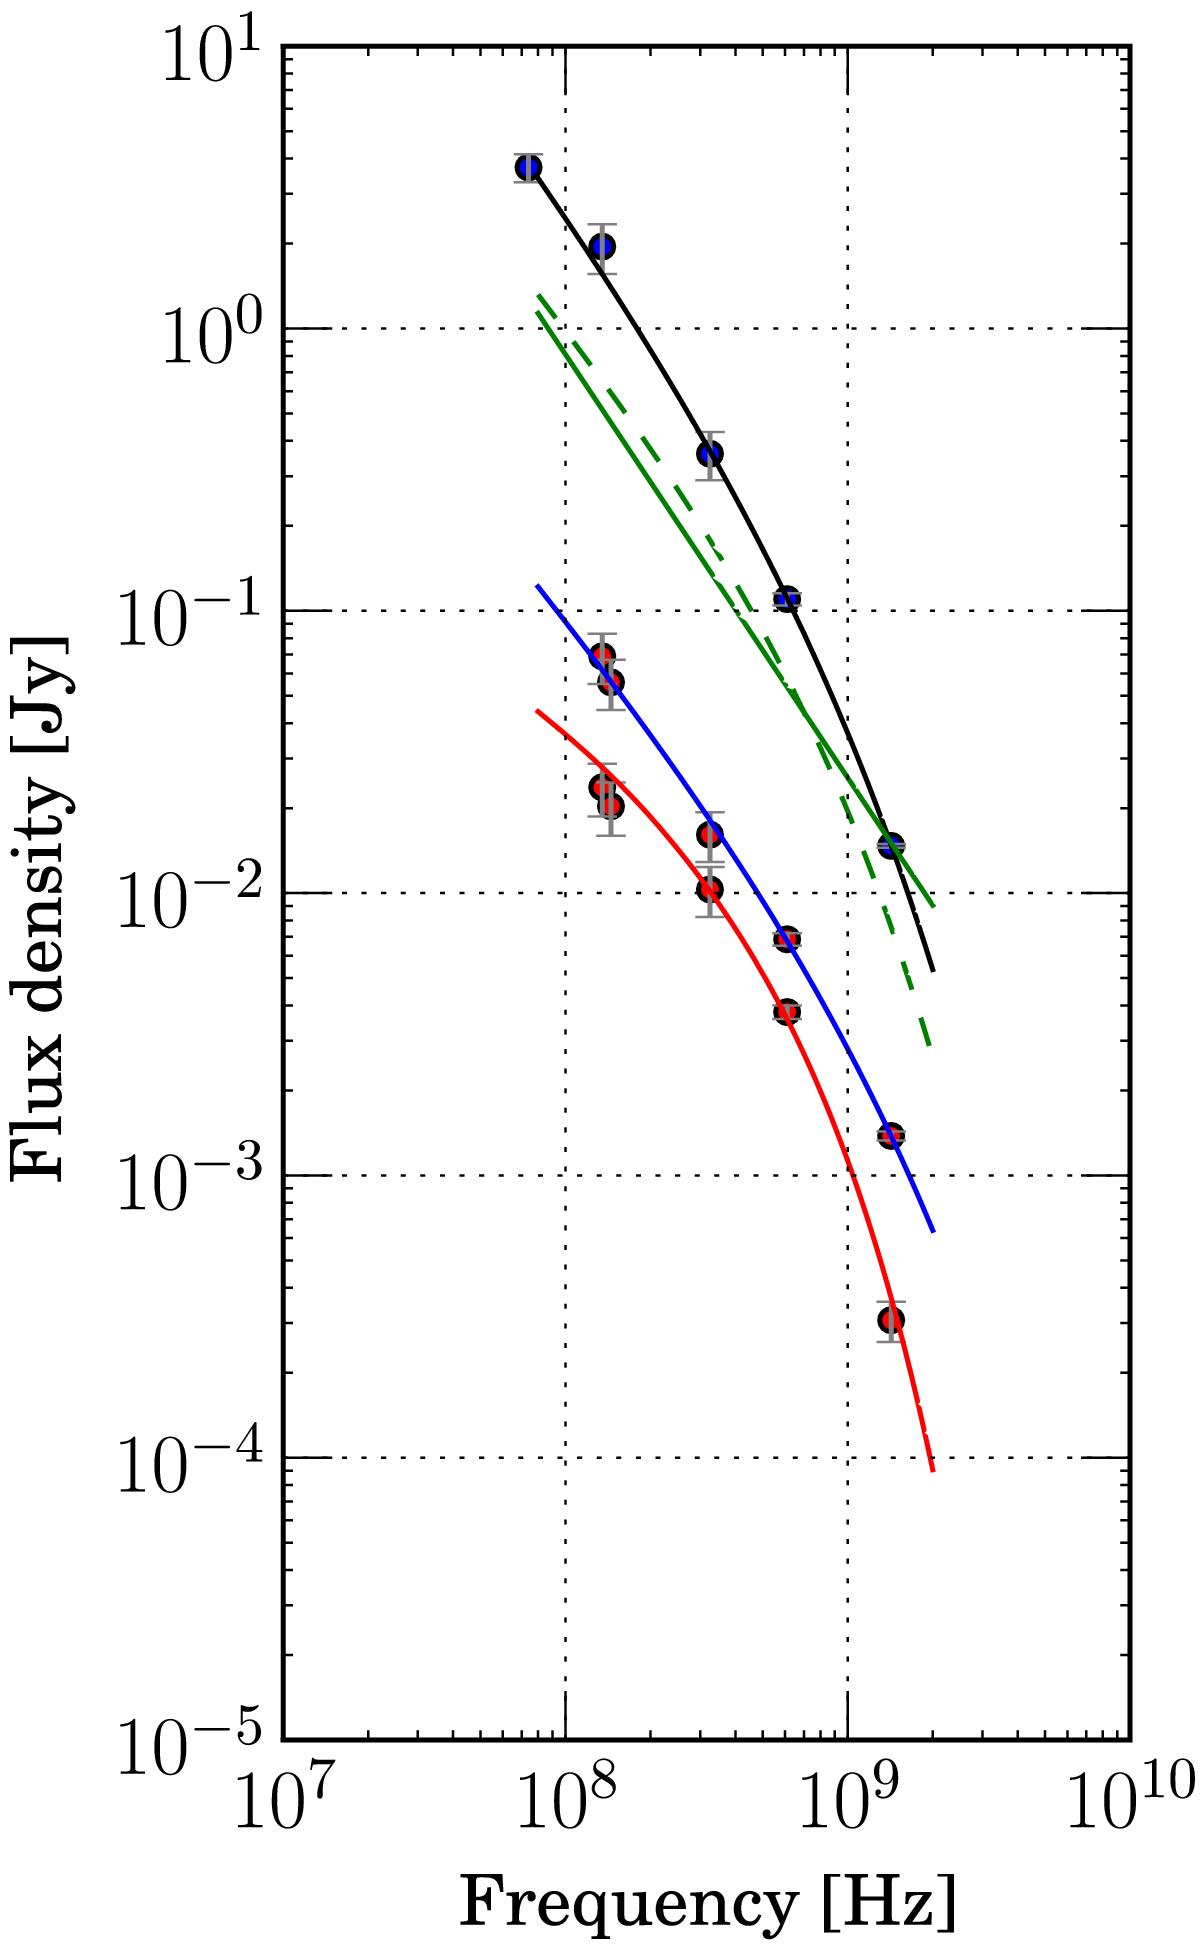
JP and KGJP model fits for Regions 4 (blue) and 16 (red), along with the corresponding data points (LOFAR HBA, GMRT, and VLA). The sum of the fits for all regions is represented by the dashed green line. The integrated flux density data points (VLSS, LOFAR HBA, GMRT, and VLA) are best fitted by a KGJP model (black line) with an injection index of α0 = −1.23 ± 0.37 and ton = 0.1 Myr, toff = 77.7 Myr. The measurement regions do not cover the source completely at lower frequencies, so the sum of the fits does not precisely follow the integrated flux density. A CI model that is rejected by the integrated flux data is represented with a green line.
Current usage metrics show cumulative count of Article Views (full-text article views including HTML views, PDF and ePub downloads, according to the available data) and Abstracts Views on Vision4Press platform.
Data correspond to usage on the plateform after 2015. The current usage metrics is available 48-96 hours after online publication and is updated daily on week days.
Initial download of the metrics may take a while.