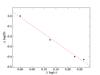
Fig. 6
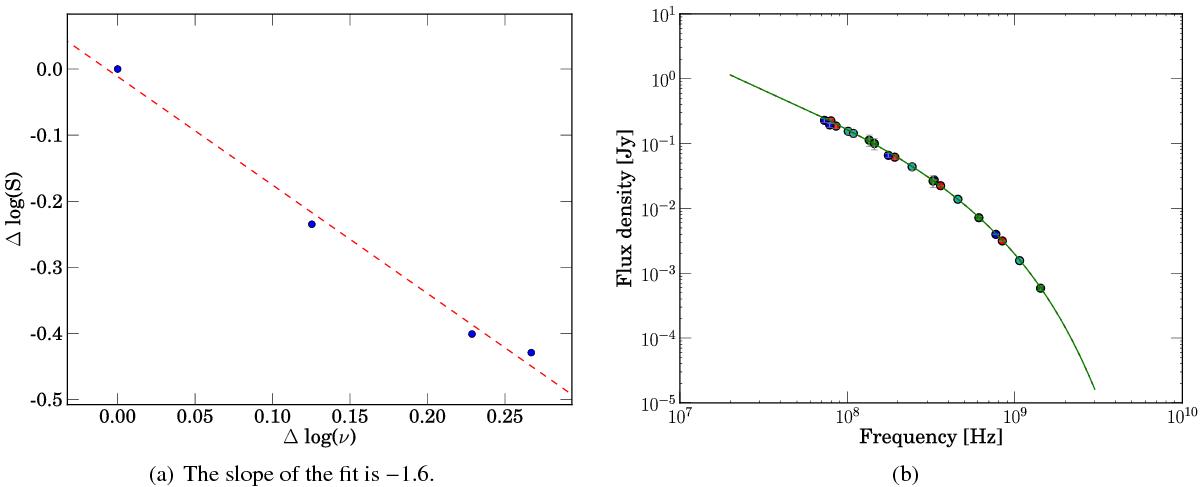
Spectral shifts in log (ν)−log (S) for Regions 3, 6, 9, and 10 in panel a). The dashed red line shows the best linear fit to the data points. Shifted data points giving the global spectrum are given in panel b). Different colours are used to indicate the data points belonging to different regions. The best JP and KGJP model fits are plotted with dashed-dot red and green lines, respectively (overlapping, since there is essentially no difference between the models for these regions).
Current usage metrics show cumulative count of Article Views (full-text article views including HTML views, PDF and ePub downloads, according to the available data) and Abstracts Views on Vision4Press platform.
Data correspond to usage on the plateform after 2015. The current usage metrics is available 48-96 hours after online publication and is updated daily on week days.
Initial download of the metrics may take a while.