Fig. 5
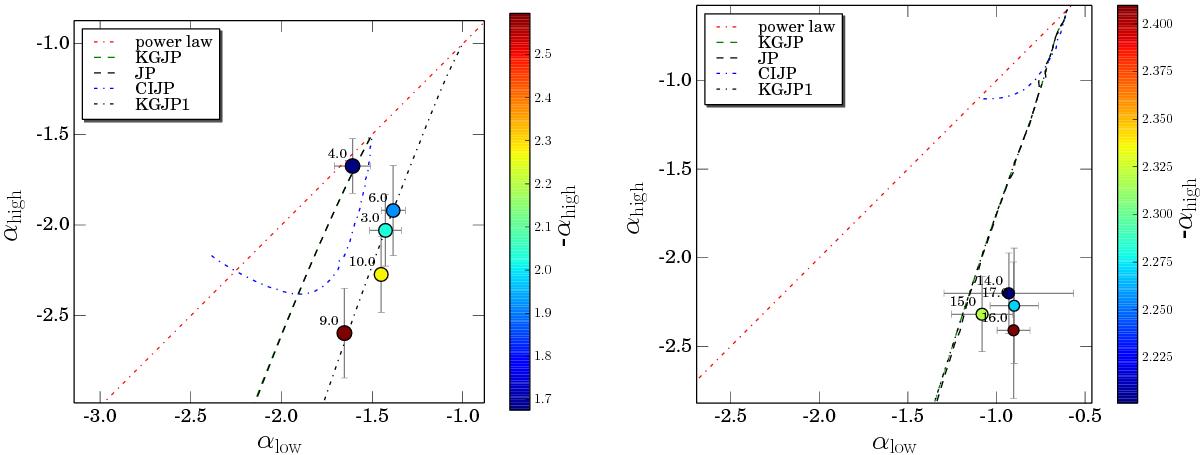
Colour–colour plots for different regions across the source. The dash-dotted red line indicates the locus of points for a power-law spectrum. Left: the dashed green line and the solid black line (overlapping) represent the locus of points taken by KGJP and JP models, respectively, with an injection index of α0 = −1.5. The dash-dotted blue line represents a CIJP model with the same injection index. The dash-dotted black line represents a KGJP model with injection index of α0 = −1. Right: the dashed green line and the dashed black line (overlapping) represent the locus of points taken by KGJP and JP models, respectively, with injection index of α0 = −0.6. The dash-dotted blue line represents a CIJP model with the same injection index. Marker sizes are proportional to the low-frequency spectral indices for a given region and marker colours are proportional to the high-frequency spectral indices. Numbers label the regions.
Current usage metrics show cumulative count of Article Views (full-text article views including HTML views, PDF and ePub downloads, according to the available data) and Abstracts Views on Vision4Press platform.
Data correspond to usage on the plateform after 2015. The current usage metrics is available 48-96 hours after online publication and is updated daily on week days.
Initial download of the metrics may take a while.