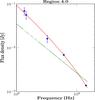
Fig. 4
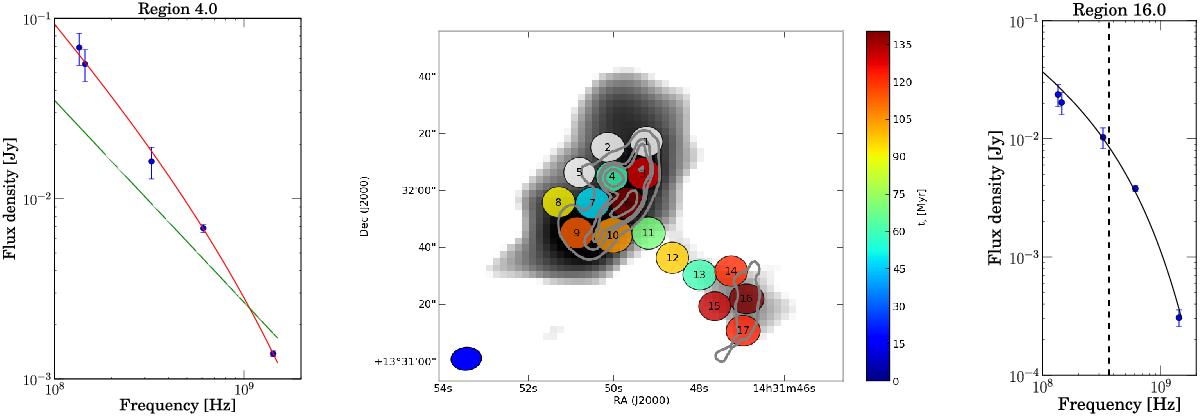
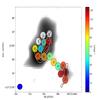
Derived total ages (ts = ton + toff) for different areas using ageing model (JP and KGJP) fits for the data. The areas are marked with coloured ellipses overlaid on a LOFAR greyscale map of the target. Overlaid are also VLA 1425 MHz high resolution contours in grey (same as in Fig. 2) indicating the position of the radio core in Area 4. Areas for which all the model fits were rejected are indicated in white. Model fits for Areas 4 and 16 are shown in the left and right panels, respectively. The green line in the plot for Area 4 represents the (rejected) CI model fit. The break frequency for Area 16 (~380 MHz) is shown with a dashed black vertical line. Detailed fit results are shown in Table 4.
Current usage metrics show cumulative count of Article Views (full-text article views including HTML views, PDF and ePub downloads, according to the available data) and Abstracts Views on Vision4Press platform.
Data correspond to usage on the plateform after 2015. The current usage metrics is available 48-96 hours after online publication and is updated daily on week days.
Initial download of the metrics may take a while.