Fig. 2
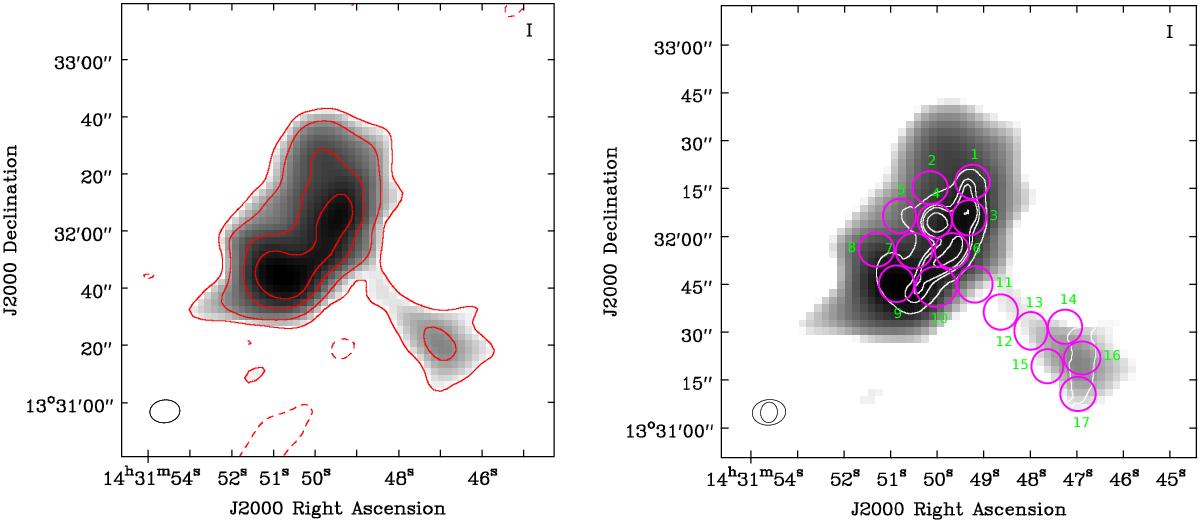
Left: LOFAR HBA greyscale image of VLSS J1431.8+1331. Overlaid contours (in red): [−6,20,40,90,150] × σ, σ = 0.5 mJy beam-1. Right: measurement regions (outlined in magenta) used in the spectral (ageing) analysis. VLA 1425 MHz high resolution contours (van Weeren et al. 2011) are shown in white, outlining a core inside Region 4. Contour levels: [− 3,3,9,12,20] × 4 × 10-2 mJy beam-1. The beam sizes are indicated in the lower left corner.
Current usage metrics show cumulative count of Article Views (full-text article views including HTML views, PDF and ePub downloads, according to the available data) and Abstracts Views on Vision4Press platform.
Data correspond to usage on the plateform after 2015. The current usage metrics is available 48-96 hours after online publication and is updated daily on week days.
Initial download of the metrics may take a while.