Fig. 1
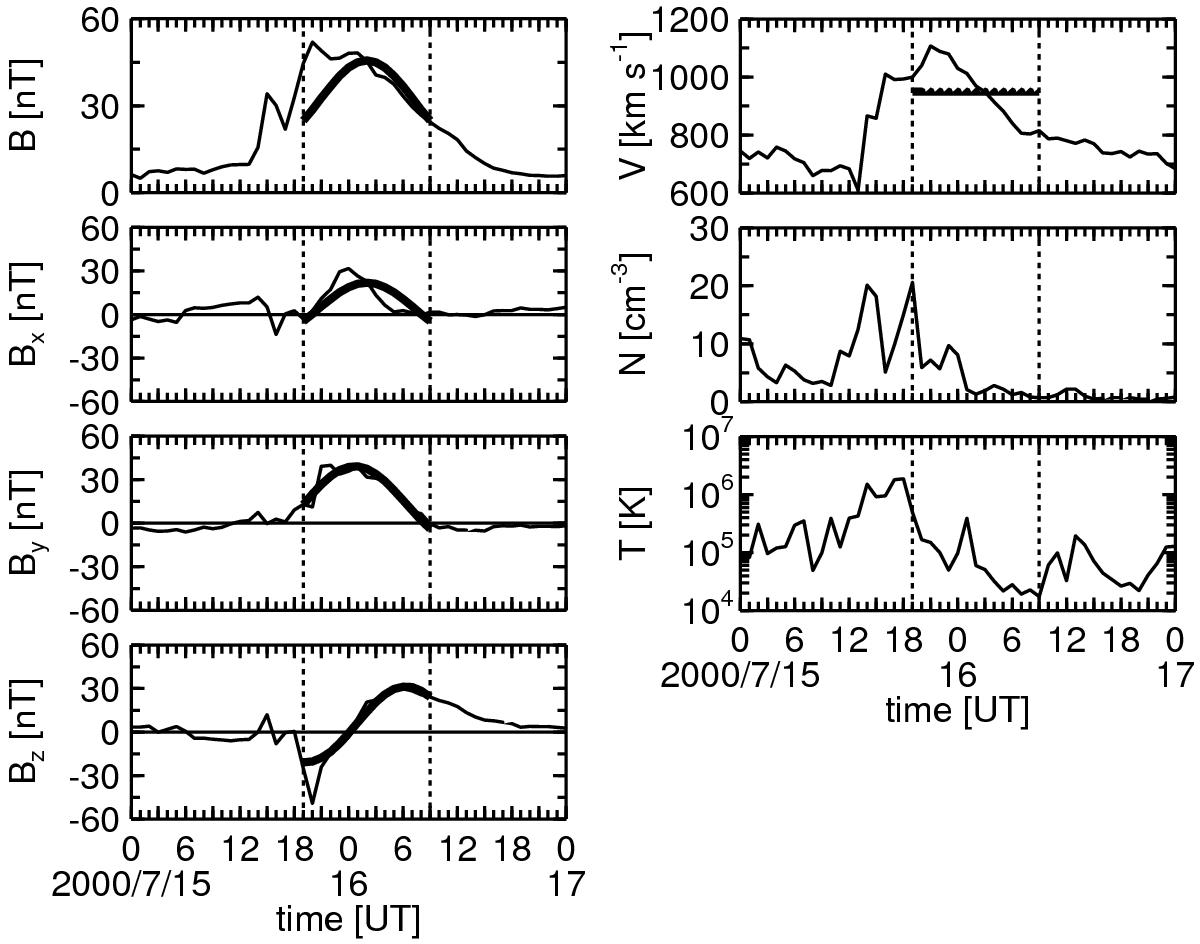
Magnetic cloud of July 15–16, 2000 observed near the Earth. Measurements (hourly averages) of the solar wind quantities are plotted: magnetic field magnitude B and components Bx, By, and Bz in the geocentric solar ecliptic (GSE) system, velocity V, density N, and proton temperature T. Estimated cloud boundaries are drawn by the vertical dashed lines. Observations are plotted by the thin line, and the thick line is a fit by a model (static circular cylindrical flux rope). More details on it are given in Sect. 2. The cloud is numbered 46.0 in Table 1.
Current usage metrics show cumulative count of Article Views (full-text article views including HTML views, PDF and ePub downloads, according to the available data) and Abstracts Views on Vision4Press platform.
Data correspond to usage on the plateform after 2015. The current usage metrics is available 48-96 hours after online publication and is updated daily on week days.
Initial download of the metrics may take a while.