Fig. 8
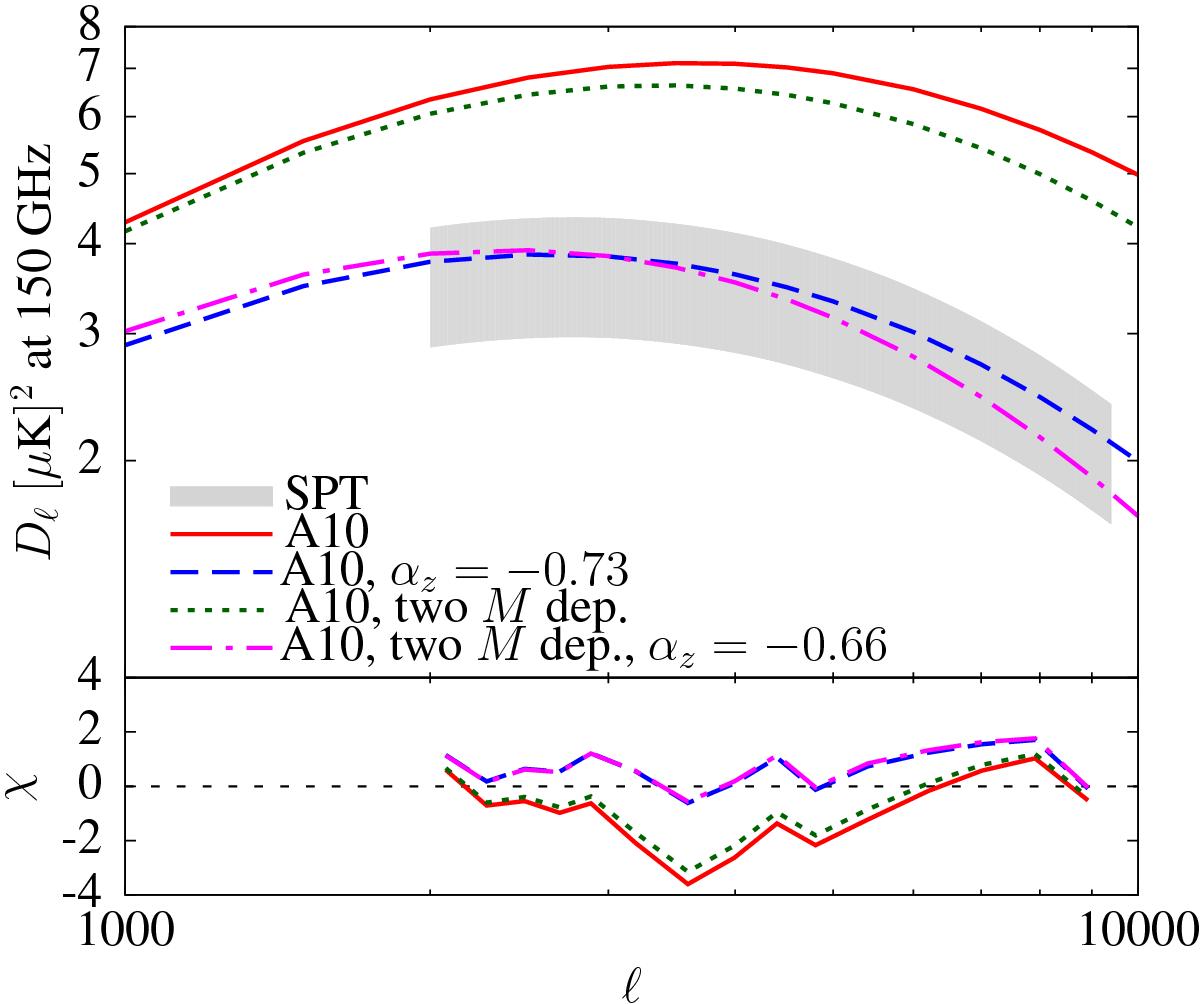
Predictions for the tSZ power spectrum for a weak departure from self-similarity, factoring in additional mass-dependence for the scaling. The red solid line and the gray shaded regions have the same meaning as in earlier figures. The blue dashed line represents the tSZ power spectrum with αz = −0.73 (Eq. (11)), as in Fig. 7. The green dotted line is given by a modified A10 pressure profile that has double mass dependence: fgas ∝ M0.2 for masses below M500 = 1014h-1M⊙, and fgas ∝ M0.12 above this mass limit. Since this change alone is not enough to reach the SPT constraints, we need to introduce a redshift evolution, the result of which is shown by the magenta dash-dotted line.
Current usage metrics show cumulative count of Article Views (full-text article views including HTML views, PDF and ePub downloads, according to the available data) and Abstracts Views on Vision4Press platform.
Data correspond to usage on the plateform after 2015. The current usage metrics is available 48-96 hours after online publication and is updated daily on week days.
Initial download of the metrics may take a while.