Fig. 7
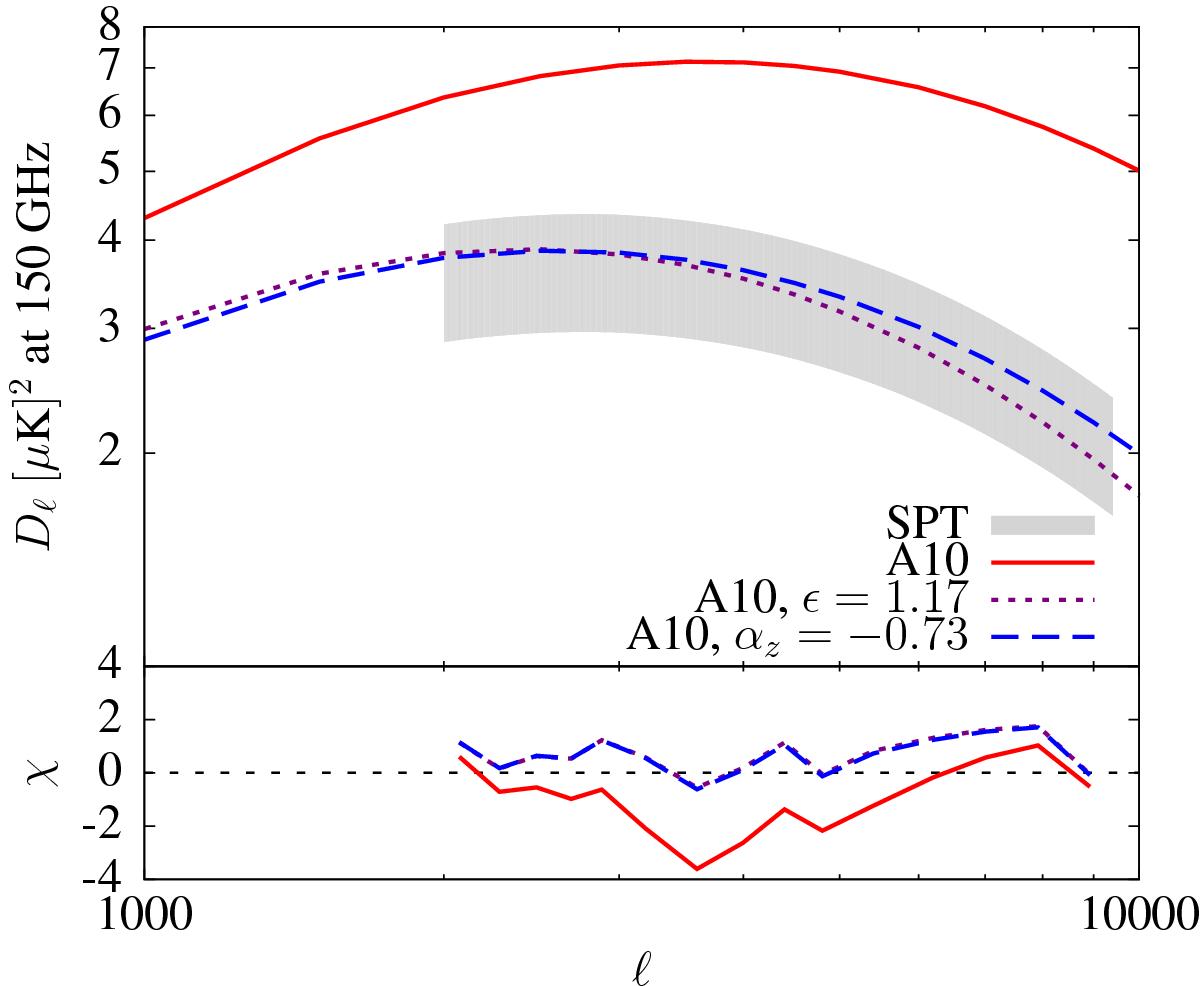
Predictions for the tSZ power spectrum for a weak departure from self-similarity, affecting only the pressure normalization. The red solid line is the tSZ power spectrum given by the A10 pressure model, and the shaded gray region is the 1σ scatter around the best fit Shaw model with SPT data. The blue dashed line represents the A10 model with ϵ = 1.17 (Eq. (12)). The purple dotted line represents A10 model with αz = −0.73 (Eq. (11)). Both parameters, ϵ and αz, modify the redshift evolution of the pressure profile to reduce its amplitude at high-z.
Current usage metrics show cumulative count of Article Views (full-text article views including HTML views, PDF and ePub downloads, according to the available data) and Abstracts Views on Vision4Press platform.
Data correspond to usage on the plateform after 2015. The current usage metrics is available 48-96 hours after online publication and is updated daily on week days.
Initial download of the metrics may take a while.