Fig. 5
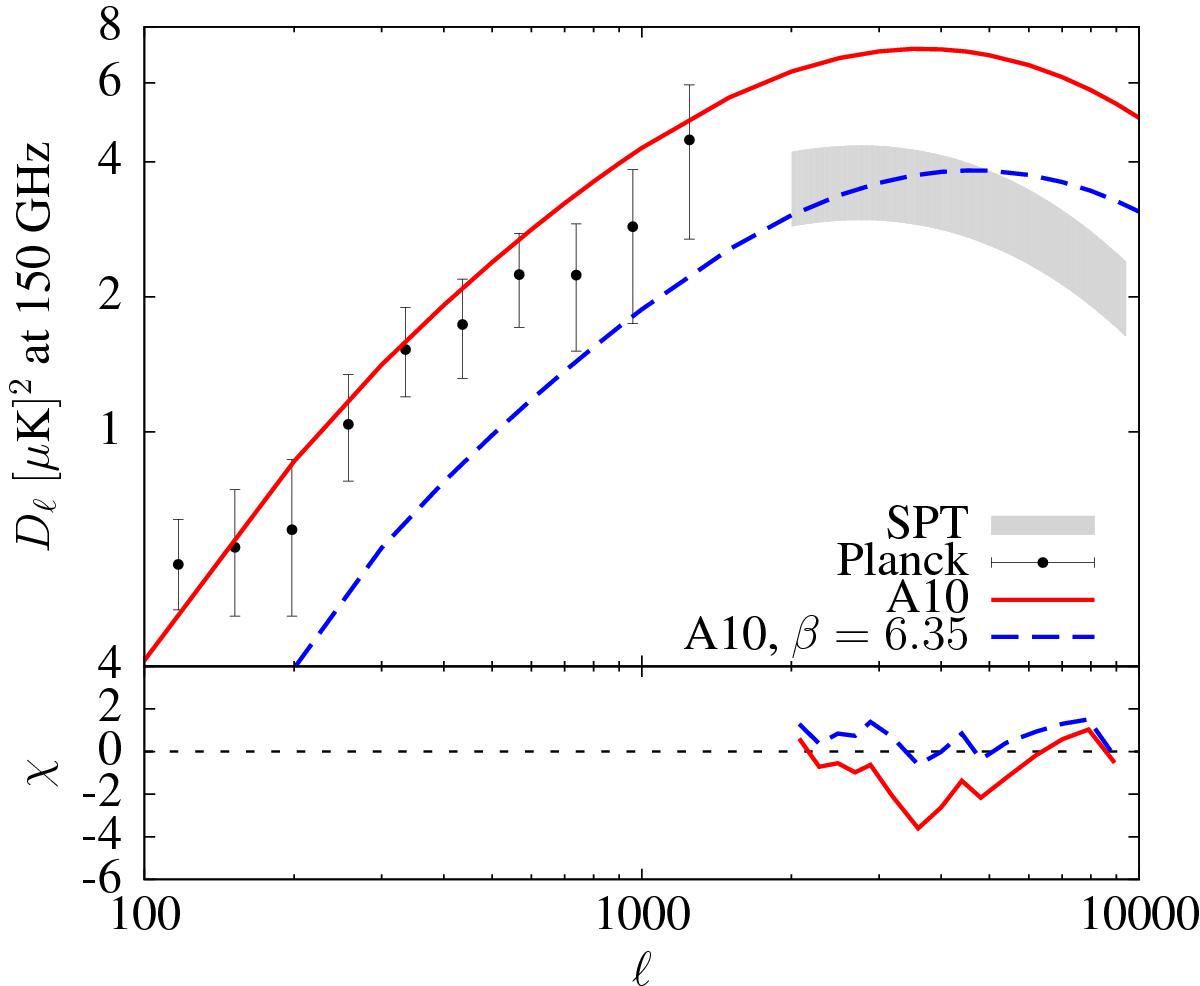
Predictions for the tSZ power spectrum for self-similar evolution. The red solid line is the tSZ power spectrum given by the A10 pressure profile (Eq. (9)). The shaded gray region represent the 1σ constraints from the SPT based on the Shaw et al. (2010) template (see text for details). The blue dashed line represents the GNFW model with our best fit outer slope (β = 6.35), which provides good fit to the actual SPT data, as shown by the χ plot in the bottom panel. The black data points are the marginalized bandpowers of the Planck tSZ power spectrum, taken from Planck Collaboration XXI (2014).
Current usage metrics show cumulative count of Article Views (full-text article views including HTML views, PDF and ePub downloads, according to the available data) and Abstracts Views on Vision4Press platform.
Data correspond to usage on the plateform after 2015. The current usage metrics is available 48-96 hours after online publication and is updated daily on week days.
Initial download of the metrics may take a while.