Fig. 4
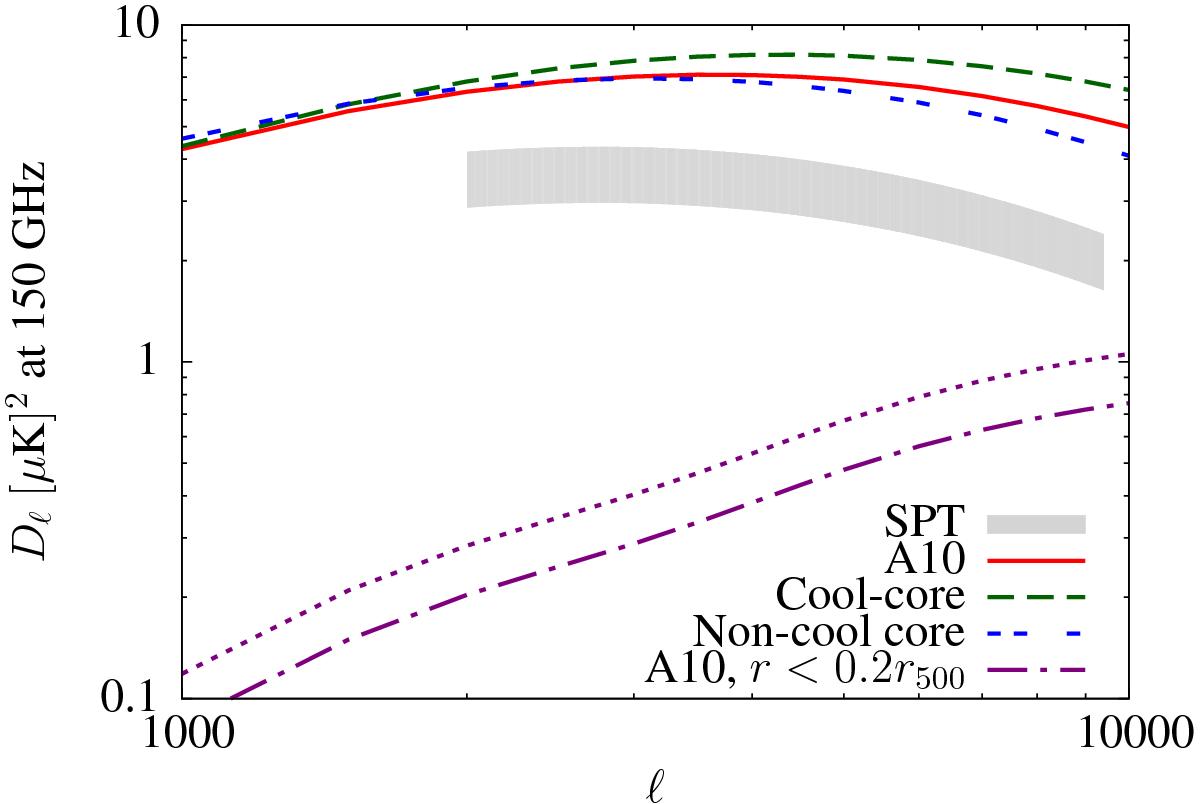
Predictions for the tSZ power spectrum for cluster morphological evolution. The red-solid line is given by the mean A10 pressure profile, the green-dashed line for cool-core clusters, and the blue short-dashed line for non-cool clusters. The purple dot-dashed line shows the relative contribution from the core regions of galaxy clusters (r< 0.2r500) to the total tSZ power, and the dotted line above it factors in an additional scatter contribution (40%) for the core region. This plot shows that, unlike the X-ray luminosity, the core region contributes very little to the tSZ anisotropy power.
Current usage metrics show cumulative count of Article Views (full-text article views including HTML views, PDF and ePub downloads, according to the available data) and Abstracts Views on Vision4Press platform.
Data correspond to usage on the plateform after 2015. The current usage metrics is available 48-96 hours after online publication and is updated daily on week days.
Initial download of the metrics may take a while.