Fig. 3
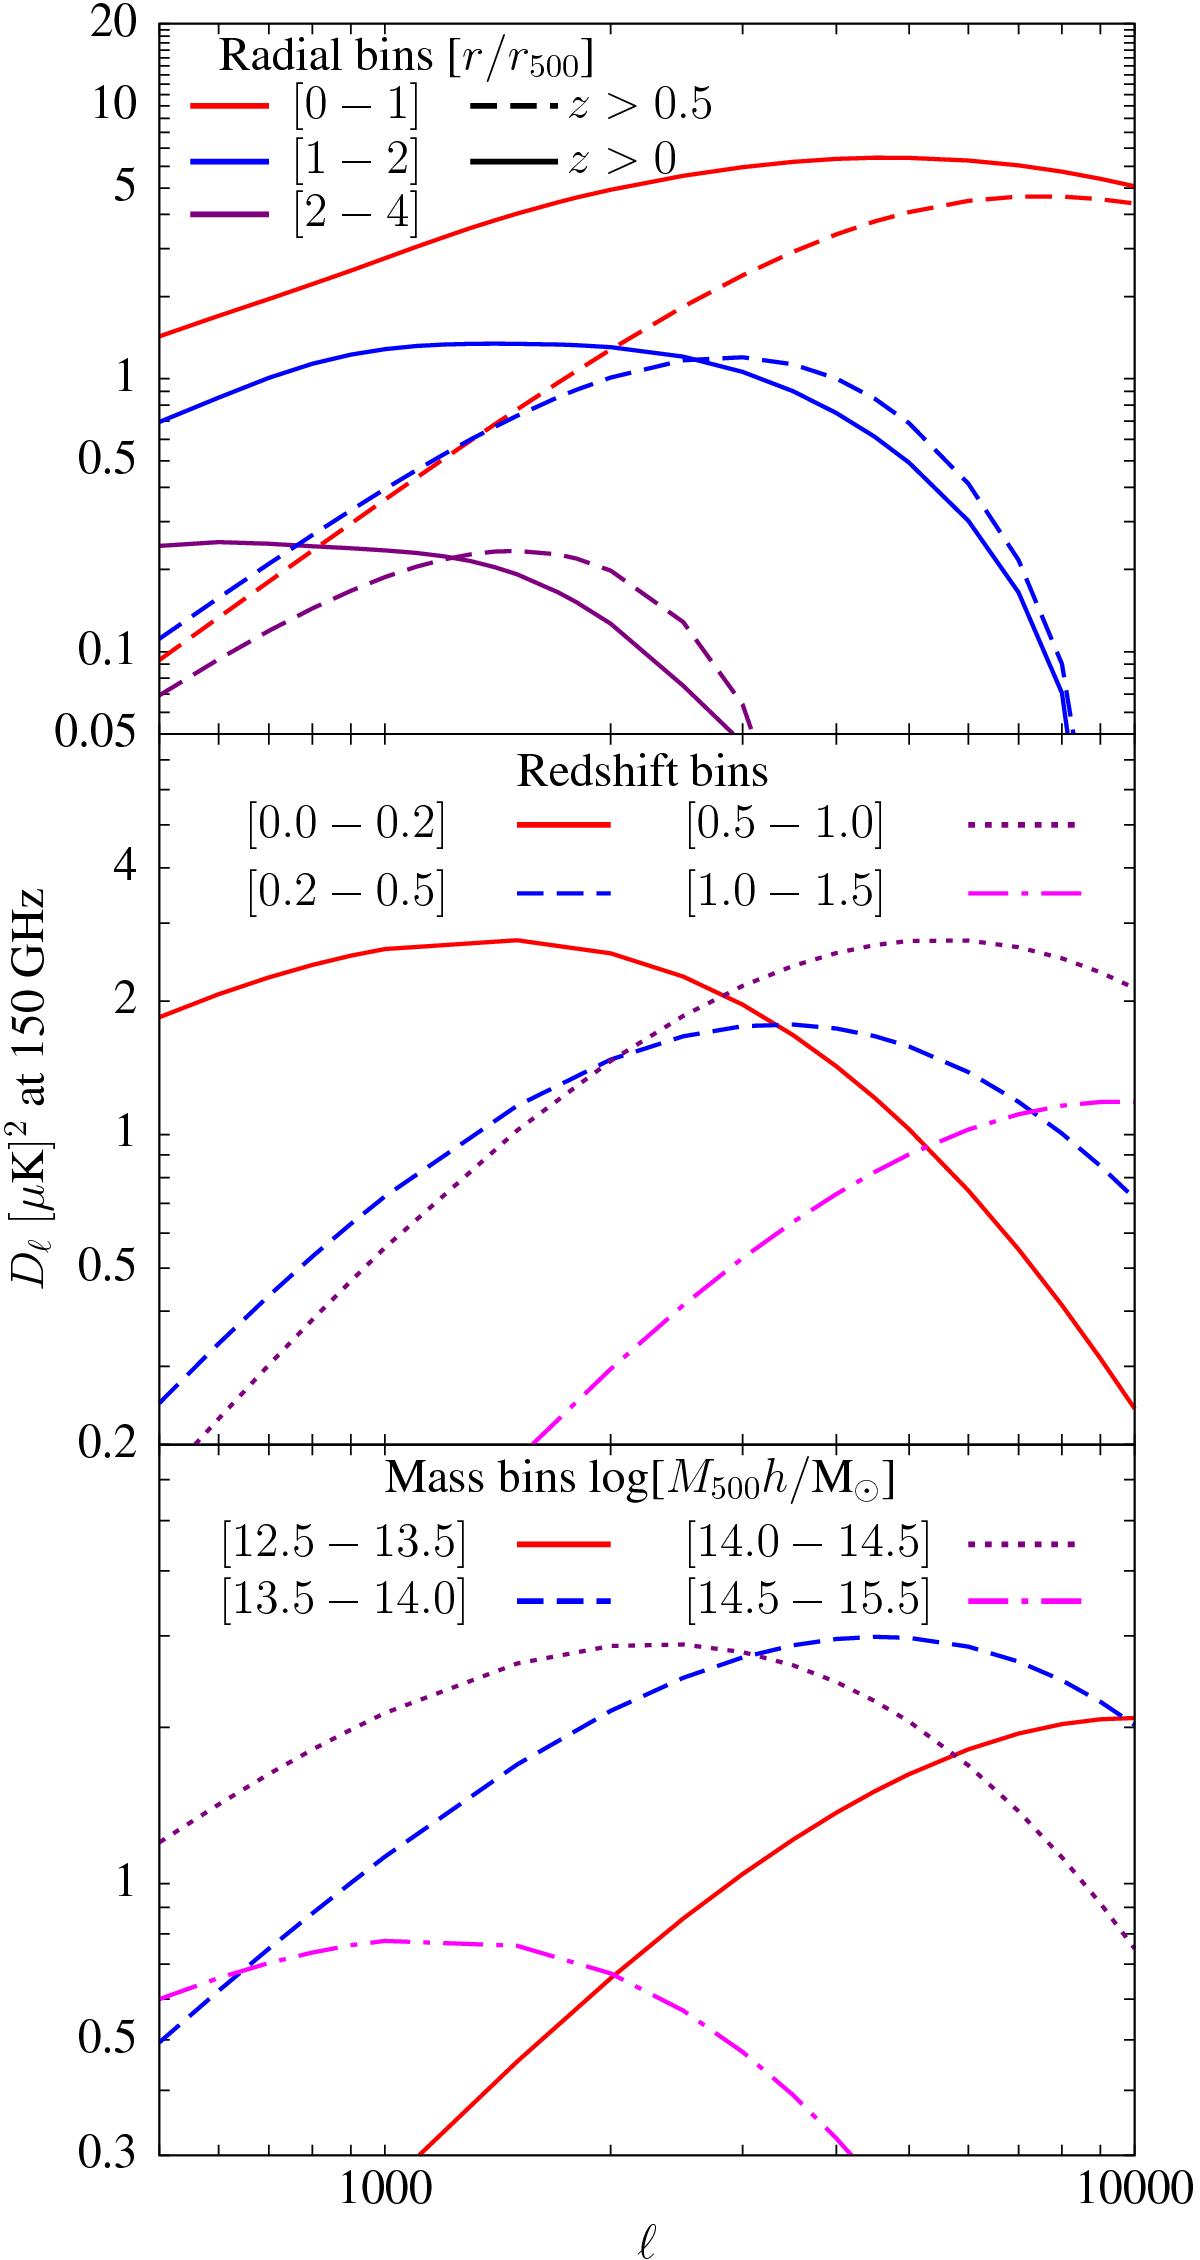
Contribution of the tSZ power spectrum in different cluster radial, mass and redshift bins. The plot is in terms of ![]() with units of [μK]2 at 150 GHz. For these illustrative plots we have used the A10 pressure profile without modifications, and factored in the contribution from intrinsic scatter. The numbers in the square brackets mark the radial, redshift and mass bins for the individual curves. In the upper panel, the dashed lines only show the contribution from high-redshift (z> 0.5) clusters. The anisotropy power from cluster outskirts (r>r500) becomes increasingly important at ℓ ≲ 3000.
with units of [μK]2 at 150 GHz. For these illustrative plots we have used the A10 pressure profile without modifications, and factored in the contribution from intrinsic scatter. The numbers in the square brackets mark the radial, redshift and mass bins for the individual curves. In the upper panel, the dashed lines only show the contribution from high-redshift (z> 0.5) clusters. The anisotropy power from cluster outskirts (r>r500) becomes increasingly important at ℓ ≲ 3000.
Current usage metrics show cumulative count of Article Views (full-text article views including HTML views, PDF and ePub downloads, according to the available data) and Abstracts Views on Vision4Press platform.
Data correspond to usage on the plateform after 2015. The current usage metrics is available 48-96 hours after online publication and is updated daily on week days.
Initial download of the metrics may take a while.