Fig. 2
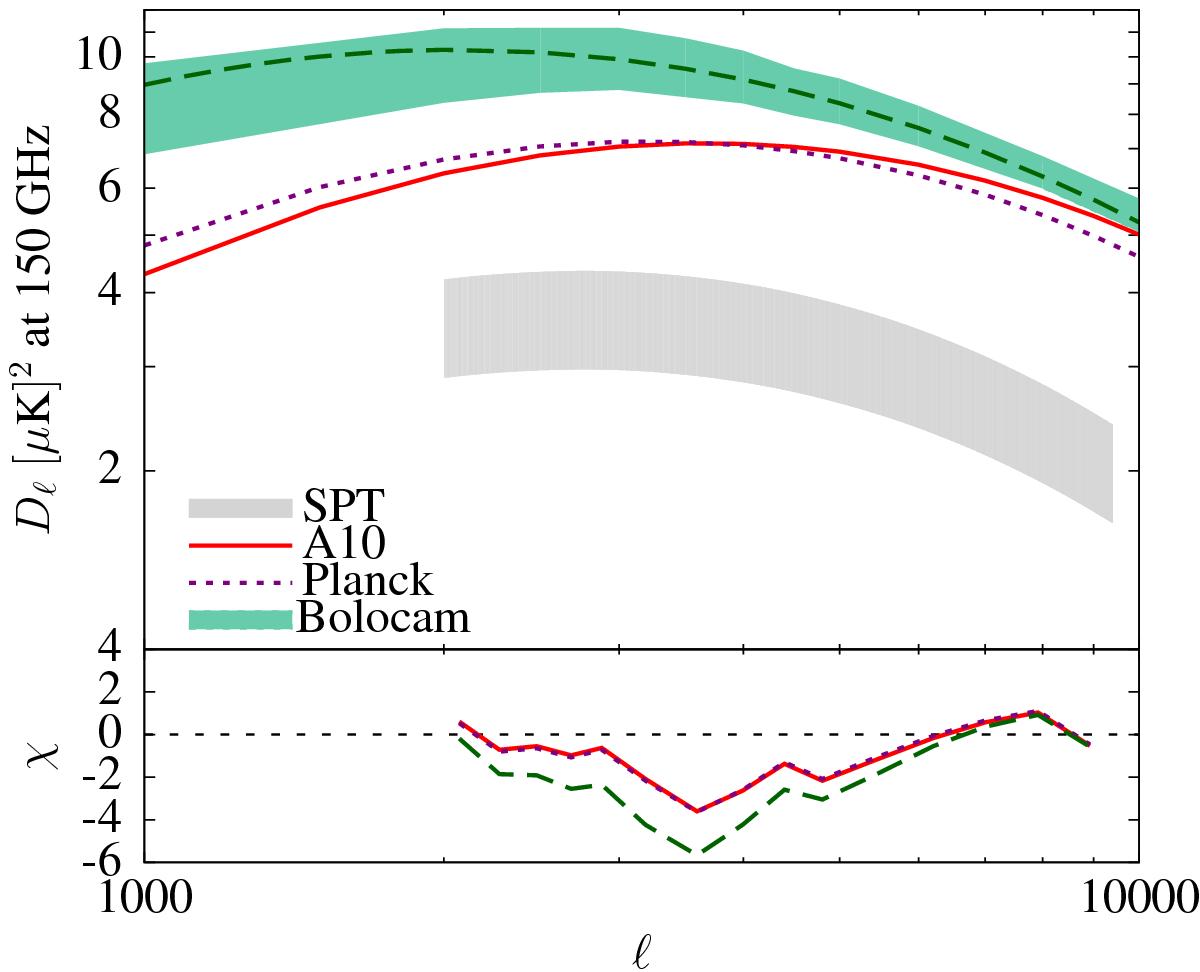
Discrepancy between the semi-analytic model predictions for the tSZ power and the SPT measurements. The red solid line is the tSZ power spectrum given by the A10 pressure profile (Eq. (9)). The shaded gray region represent the 1σ constraints from the SPT, which is restricted by the shape of the Shaw model (see text for details). The purple dot-dashed line gives the result for the mean GNFW profile as measured by Planck (Planck Collaboration XXXI 2013). The green band marks the corresponding Bolocam measurement (Sayers et al. 2013) with the 68% confidence interval on their model fit parameters. The bottom panel shows the value of χ at each point for these models with respect to the SPT bandpower measurements, in units of the measurement errors in each ℓ-band.
Current usage metrics show cumulative count of Article Views (full-text article views including HTML views, PDF and ePub downloads, according to the available data) and Abstracts Views on Vision4Press platform.
Data correspond to usage on the plateform after 2015. The current usage metrics is available 48-96 hours after online publication and is updated daily on week days.
Initial download of the metrics may take a while.