Fig. 12
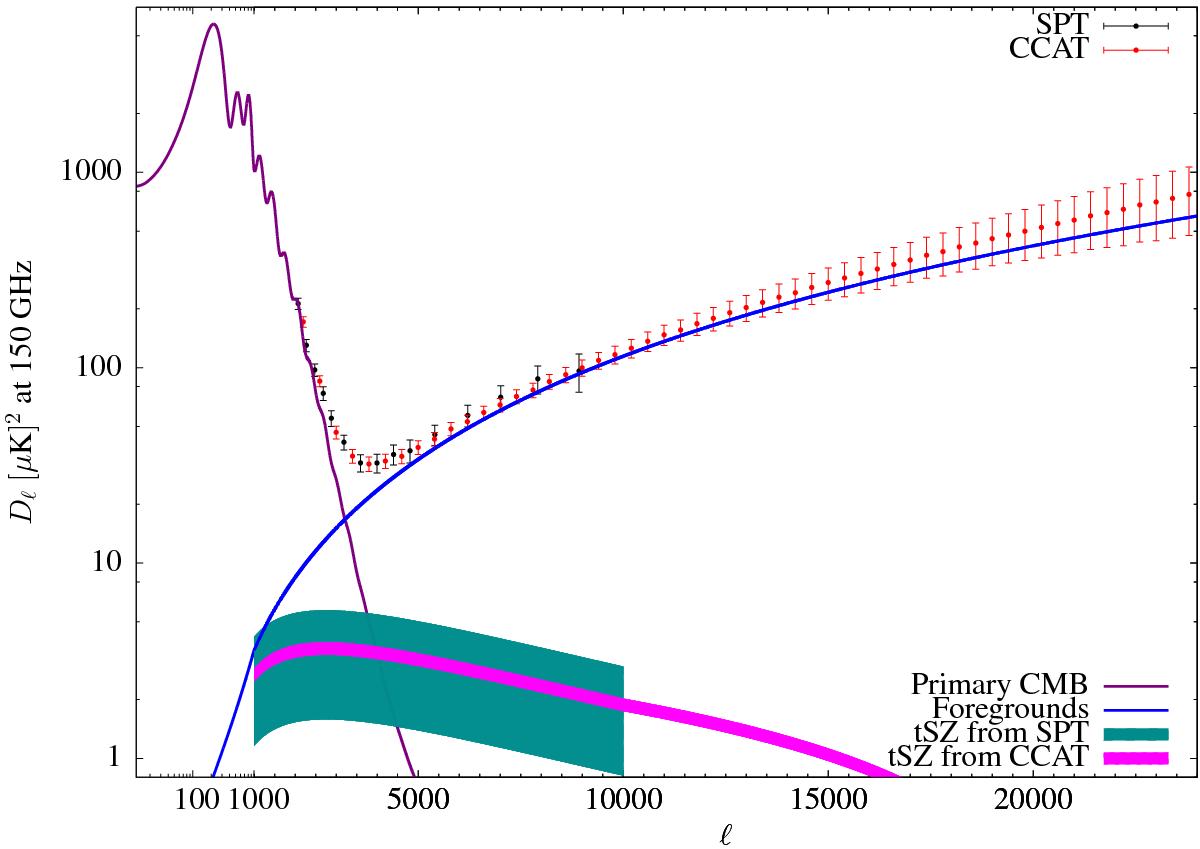
Current SPT bandpower measurements for the total CMB anisotropies (black data points, from R12), and the predicted bandpowers for CCAT (red points), shown with their respective ± 3σ errors. The thick blue line is the best fit SPT foreground model, and the purple line is the lensed CMB power spectrum. The cyan and magenta shaded regions represent the ± 3σ model uncertainties on the tSZ power spectrum from the SPT and CCAT, respectively. This figure illustrates how the improved sensitivity and angular resolution of CCAT can constrain both the amplitude and the shape of the tSZ power spectrum at the same time.
Current usage metrics show cumulative count of Article Views (full-text article views including HTML views, PDF and ePub downloads, according to the available data) and Abstracts Views on Vision4Press platform.
Data correspond to usage on the plateform after 2015. The current usage metrics is available 48-96 hours after online publication and is updated daily on week days.
Initial download of the metrics may take a while.