Fig. 11
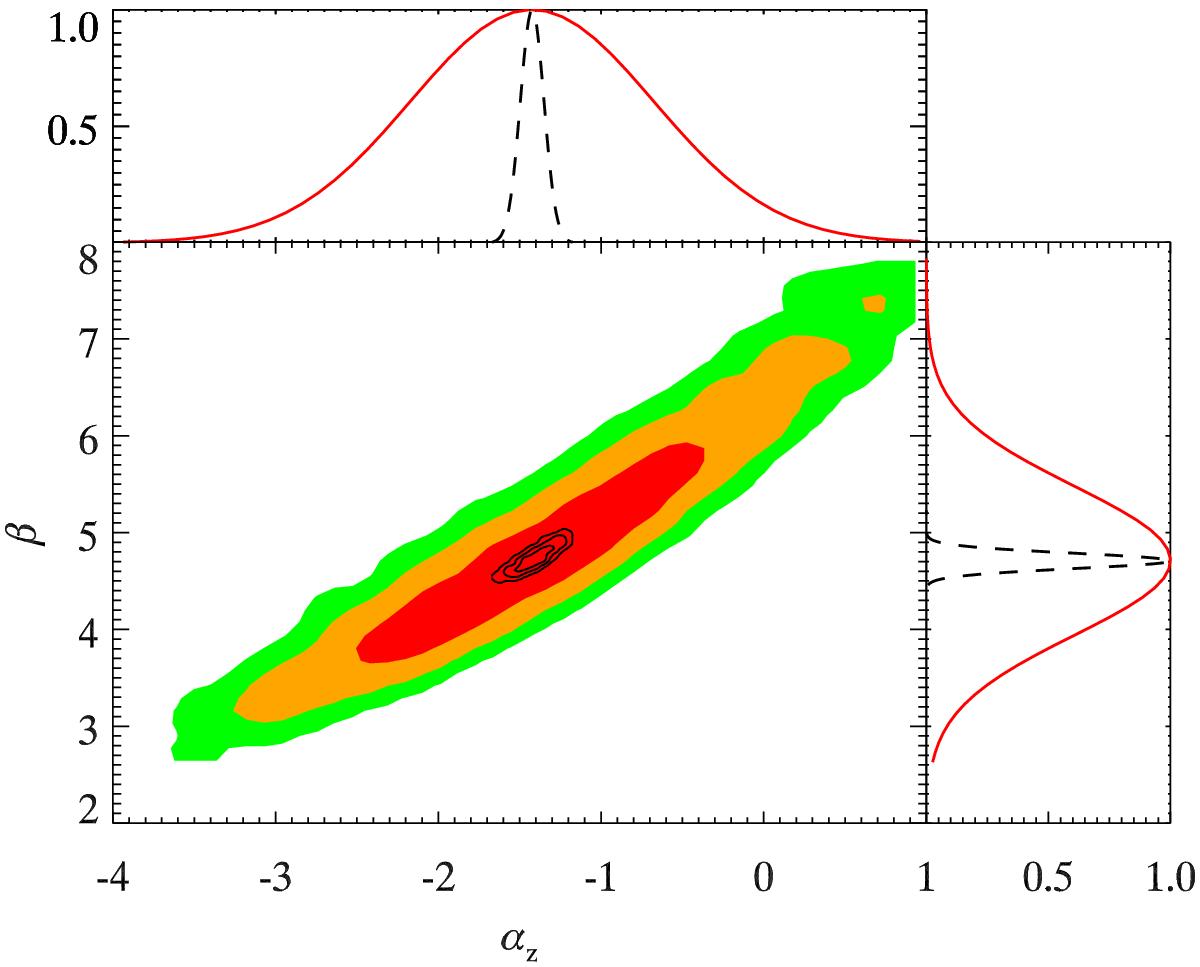
2D likelihood contours for the β and αz parameters and their marginalized values. The colored contours show the 1, 2, and 3σ constraints available from the SPT bandpowers of R12. The black solid lines show the expected constraints from the CCAT tSZ survey. The marginalized errors for CCAT (dashed lines) are almost an order of magnitude smaller.
Current usage metrics show cumulative count of Article Views (full-text article views including HTML views, PDF and ePub downloads, according to the available data) and Abstracts Views on Vision4Press platform.
Data correspond to usage on the plateform after 2015. The current usage metrics is available 48-96 hours after online publication and is updated daily on week days.
Initial download of the metrics may take a while.