Fig. 10
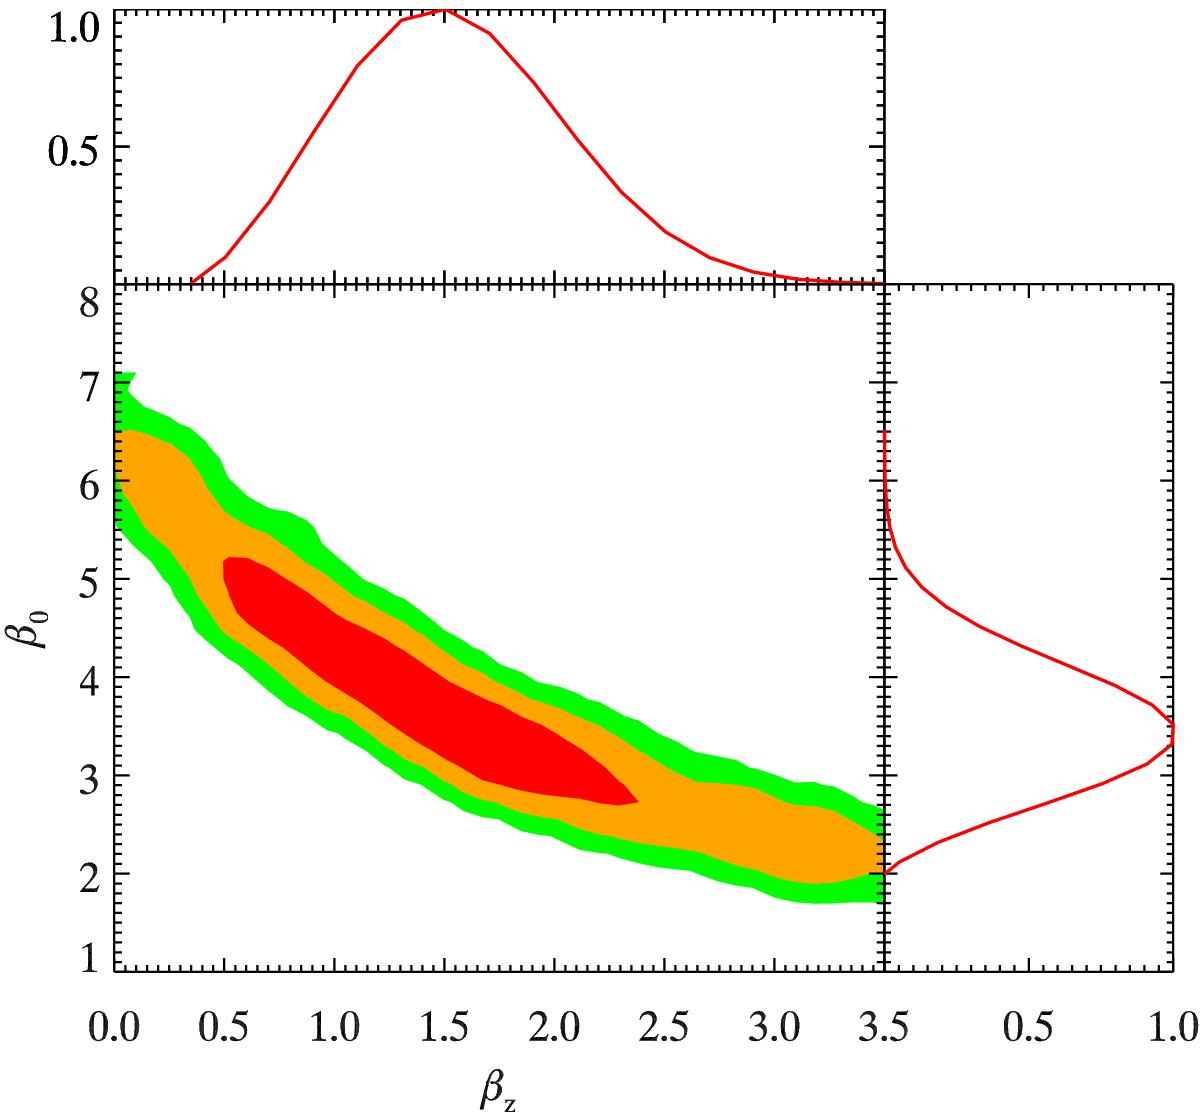
2D Likelihood contours for the correlation between the β0 (the outer slope parameter at z = 0) and βz (its redshift evolution, see Eq. (16)). The colored contours show the 1, 2, and 3σ constraints, and the marginalized values are shown in the side panels. Both β0 and βz tend to lower the tSZ power amplitude and hence anti-correlate.
Current usage metrics show cumulative count of Article Views (full-text article views including HTML views, PDF and ePub downloads, according to the available data) and Abstracts Views on Vision4Press platform.
Data correspond to usage on the plateform after 2015. The current usage metrics is available 48-96 hours after online publication and is updated daily on week days.
Initial download of the metrics may take a while.