Fig. 1
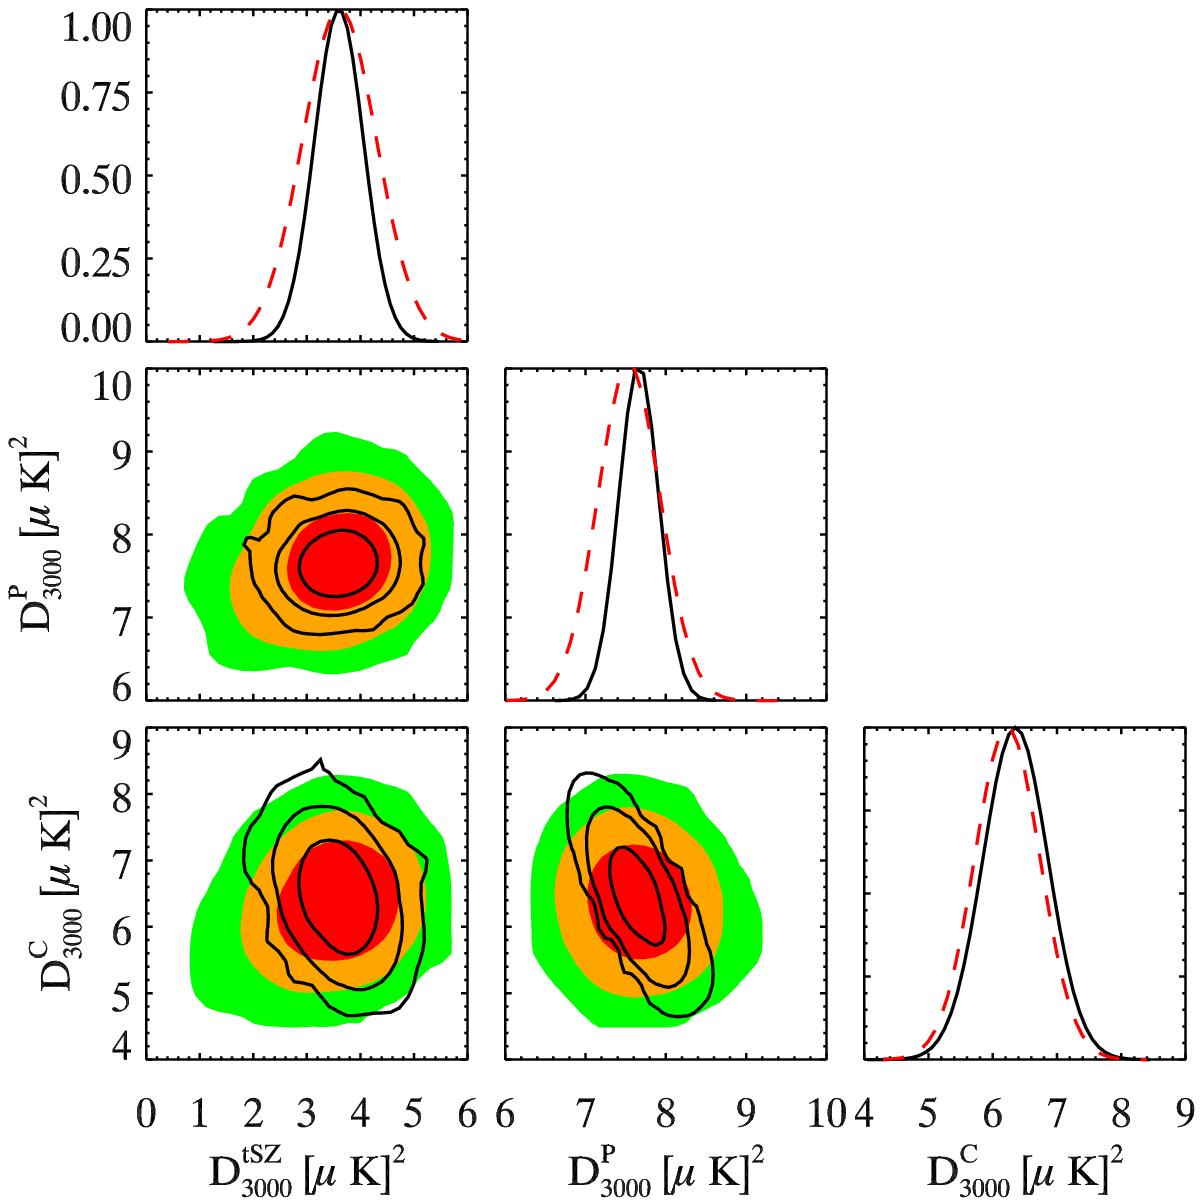
2D likelihoods for the power spectra amplitudes at ℓ = 3000 using our MCMC algorithm, compared to the results from R12. The plot shows the tSZ power spectrum (![]() ) using the template of Shaw et al. (2010), and the two CIB components, its Poisson contribution (
) using the template of Shaw et al. (2010), and the two CIB components, its Poisson contribution (![]() ) and the clustered component (
) and the clustered component (![]() ). The filled colored contours show the 1, 2, and 3σ constraints from the SPT analysis. The black solid contours show the constraints from our MCMC sampling, where the other foregrounds are held fixed together with the cosmological parameters.
). The filled colored contours show the 1, 2, and 3σ constraints from the SPT analysis. The black solid contours show the constraints from our MCMC sampling, where the other foregrounds are held fixed together with the cosmological parameters.
Current usage metrics show cumulative count of Article Views (full-text article views including HTML views, PDF and ePub downloads, according to the available data) and Abstracts Views on Vision4Press platform.
Data correspond to usage on the plateform after 2015. The current usage metrics is available 48-96 hours after online publication and is updated daily on week days.
Initial download of the metrics may take a while.