Free Access
Fig. 5
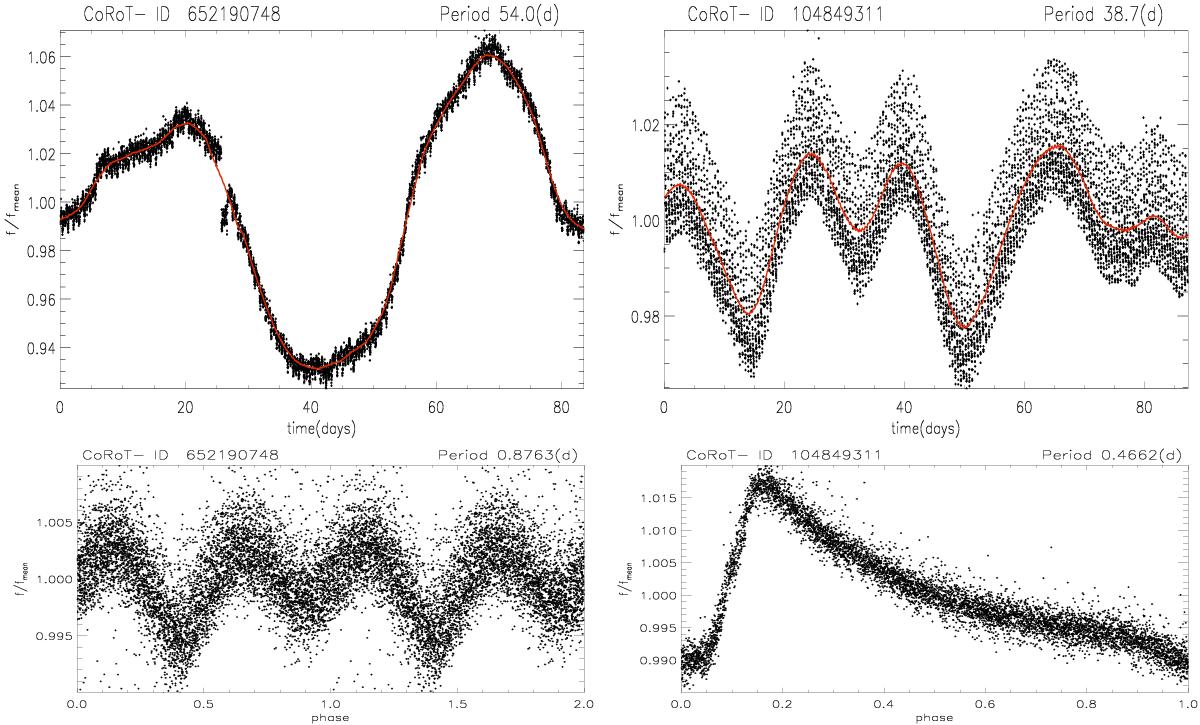
CoRoT 652190748 and CoRoT 104849311 light curves (upper panels). The red line indicates a boxcar smoothed version of the LC. The phase diagrams of their short-time variations are depicted in the lower panels. The CoRoT-ID and period are presented in each panel.
Current usage metrics show cumulative count of Article Views (full-text article views including HTML views, PDF and ePub downloads, according to the available data) and Abstracts Views on Vision4Press platform.
Data correspond to usage on the plateform after 2015. The current usage metrics is available 48-96 hours after online publication and is updated daily on week days.
Initial download of the metrics may take a while.