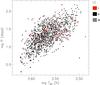
Fig. 3
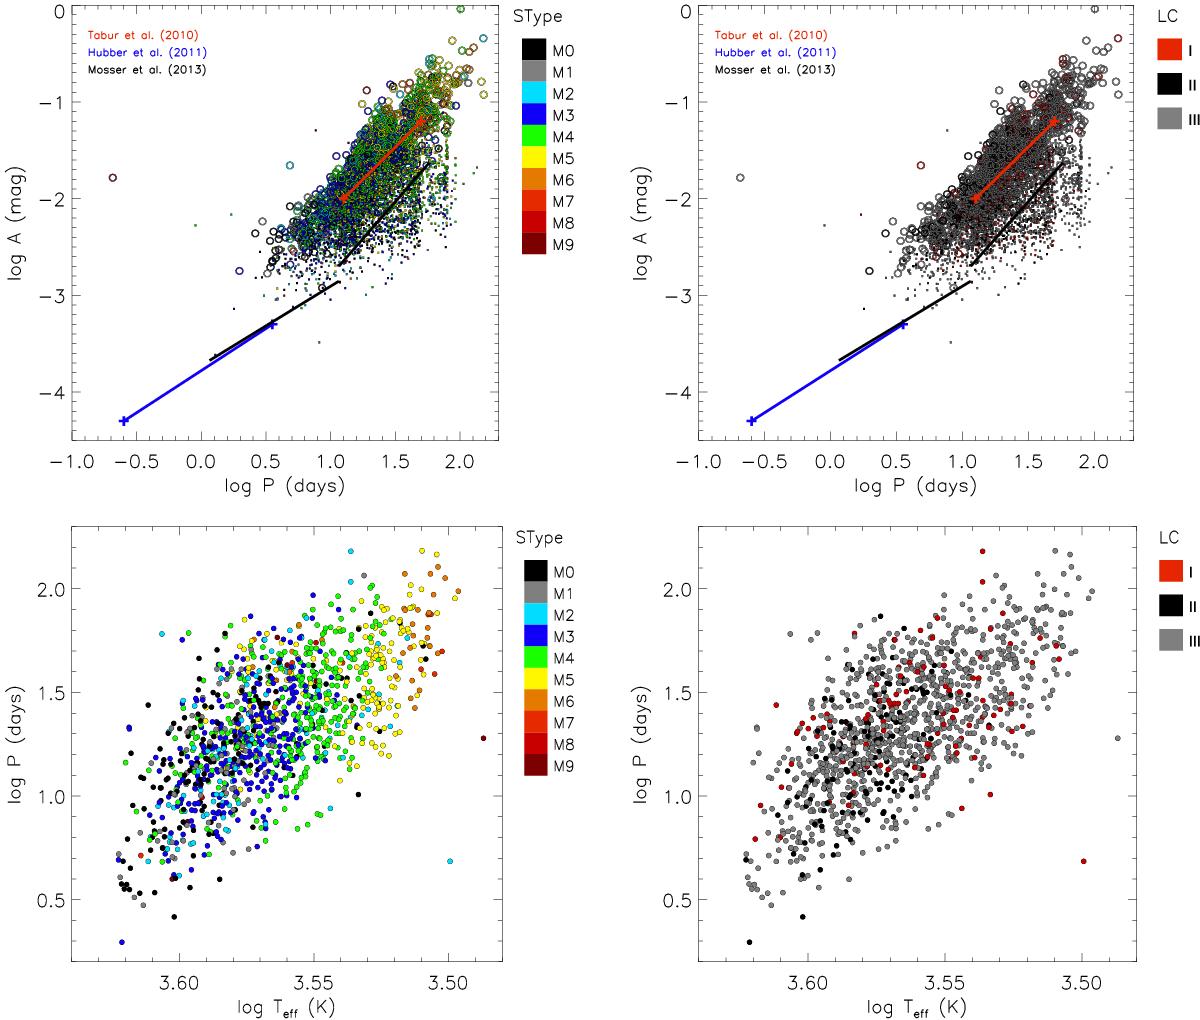
Distribution of variability period as a function of the amplitude and the effective temperature for C1 stars. The colours indicate the spectral type (left panels) and luminosity class (right panels). The large circles in the upper panels mark the main variability period and the small circles mark the secondary periods. In the lower panels, only the main variability period is shown. The red line between the two red crosses roughly depict the trend of the overtone (AB) pulsators taken from Fig. 15 of Tabur et al. (2010). The blue line between the two blue crosses represents the area defined by Bányai et al. (2013), selected from the top panel of Fig. 3 of Huber et al. (2011), where solar-like oscillations are expected to be found. The two black lines indicate the two distinct Amplitude-νmax relations for solar-type oscillators found by Mosser et al. (2013, their Eqs. (8) and (9)).
Current usage metrics show cumulative count of Article Views (full-text article views including HTML views, PDF and ePub downloads, according to the available data) and Abstracts Views on Vision4Press platform.
Data correspond to usage on the plateform after 2015. The current usage metrics is available 48-96 hours after online publication and is updated daily on week days.
Initial download of the metrics may take a while.