Fig. 2
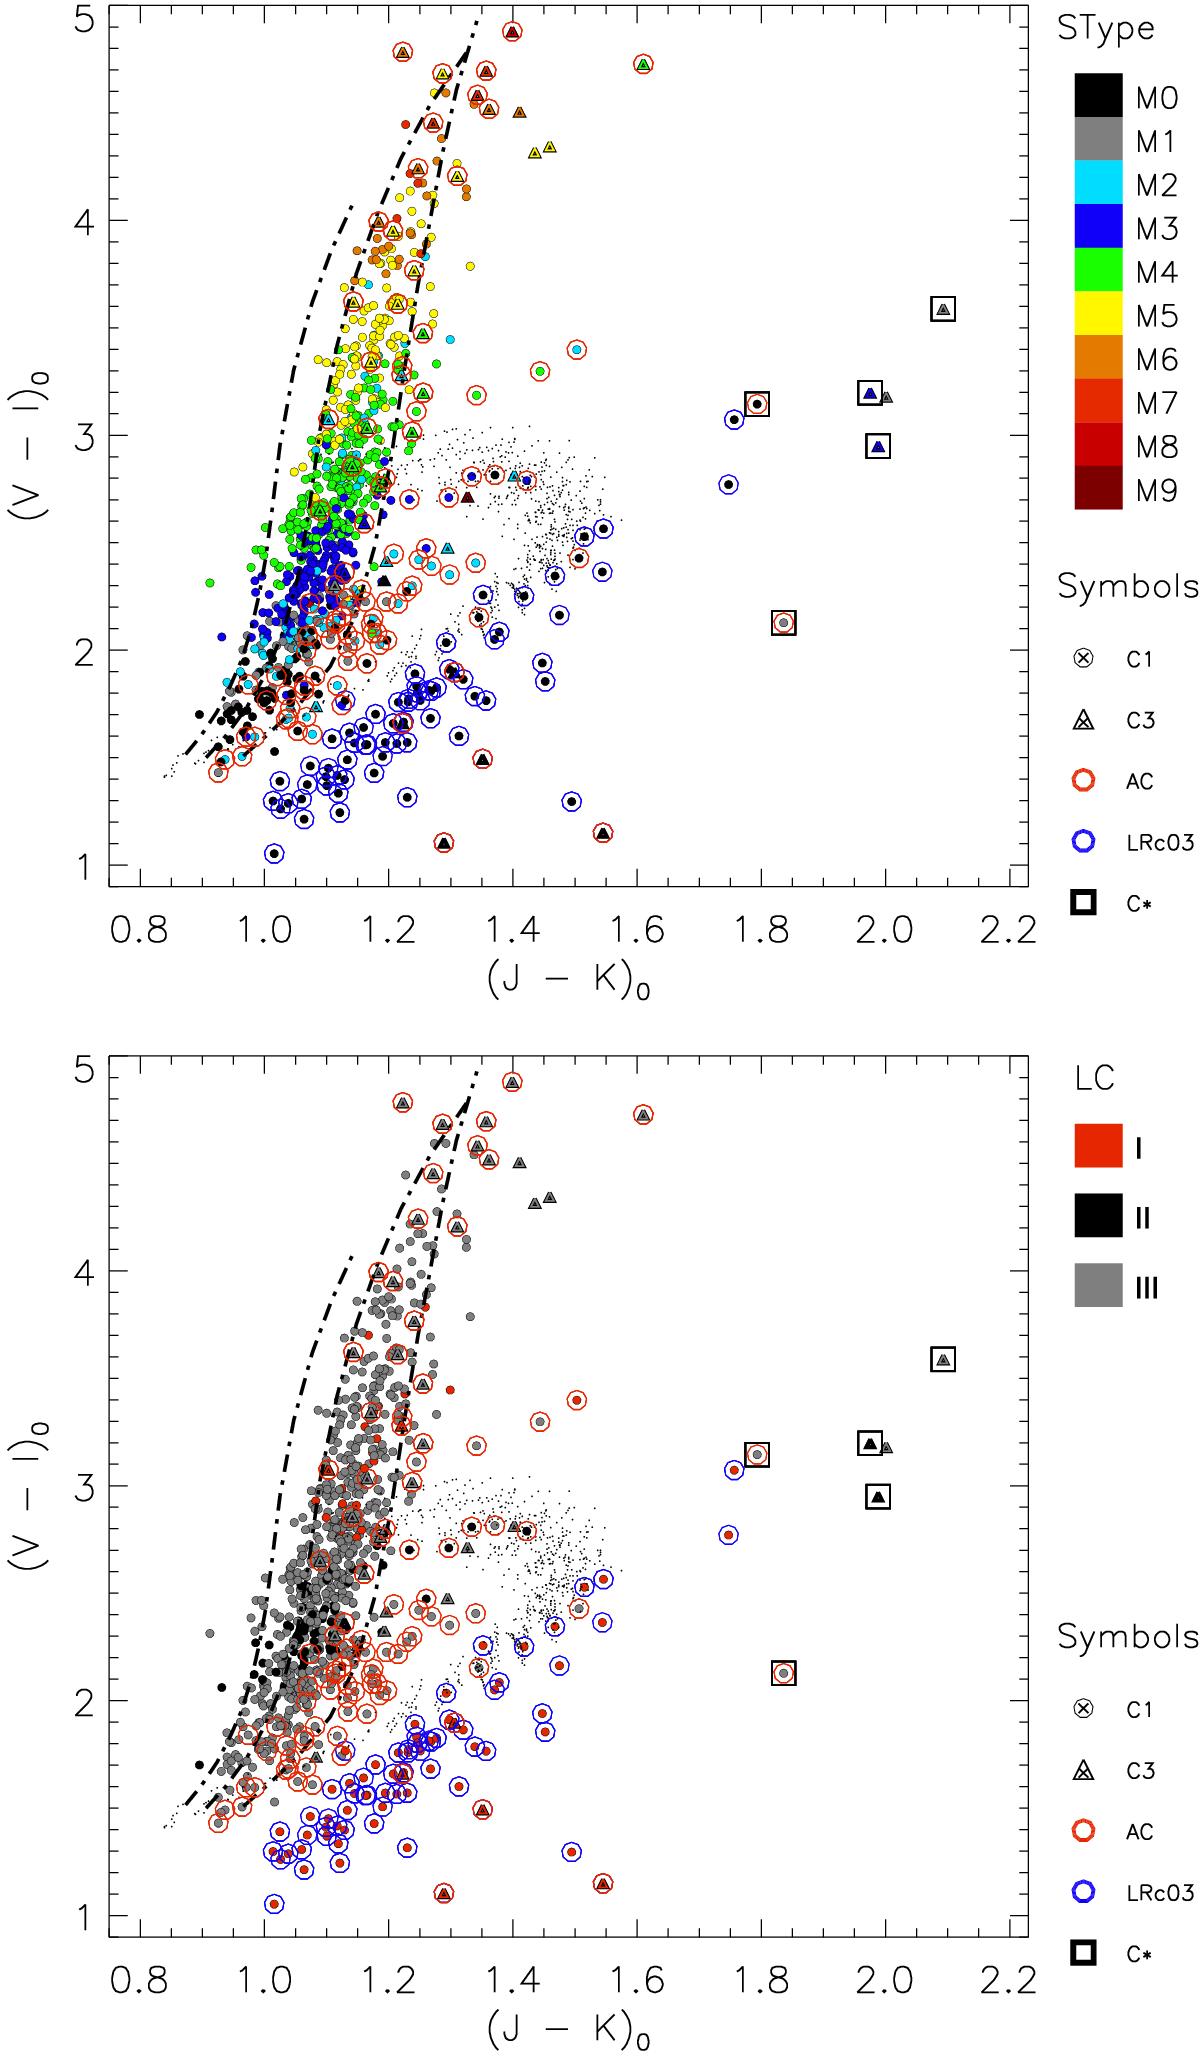
V−I vs. J−K colour–colour diagram of C1 (circles) and C3 (triangles) subsamples. The colours indicate the spectral type (upper panel) and luminosity class (lower panel). The photometric calibrations of Worthey & Lee (2011) are depicted by three dashed-dotted lines corresponding to iso-gravity contours, from left to right, of log g = 3, 2 and 0 dex. The small black dots indicate the location of hydrostatic carbon stars from the models by Aringer et al. (2009). The stars previously classified as carbon stars are depicted by a square symbol. The stars from the samples towards the outer regions of the Galaxy are indicated by open red circles, while the stars from the LRc03 CoRoT Run are identified using blue open circles. The error bars in the bottom right corner of the two diagrams represent the typical uncertainties for the colours (ϵ(V−I) = 0.29 mag and ϵ(J−K) = 0.09 mag).
Current usage metrics show cumulative count of Article Views (full-text article views including HTML views, PDF and ePub downloads, according to the available data) and Abstracts Views on Vision4Press platform.
Data correspond to usage on the plateform after 2015. The current usage metrics is available 48-96 hours after online publication and is updated daily on week days.
Initial download of the metrics may take a while.