Fig. 5
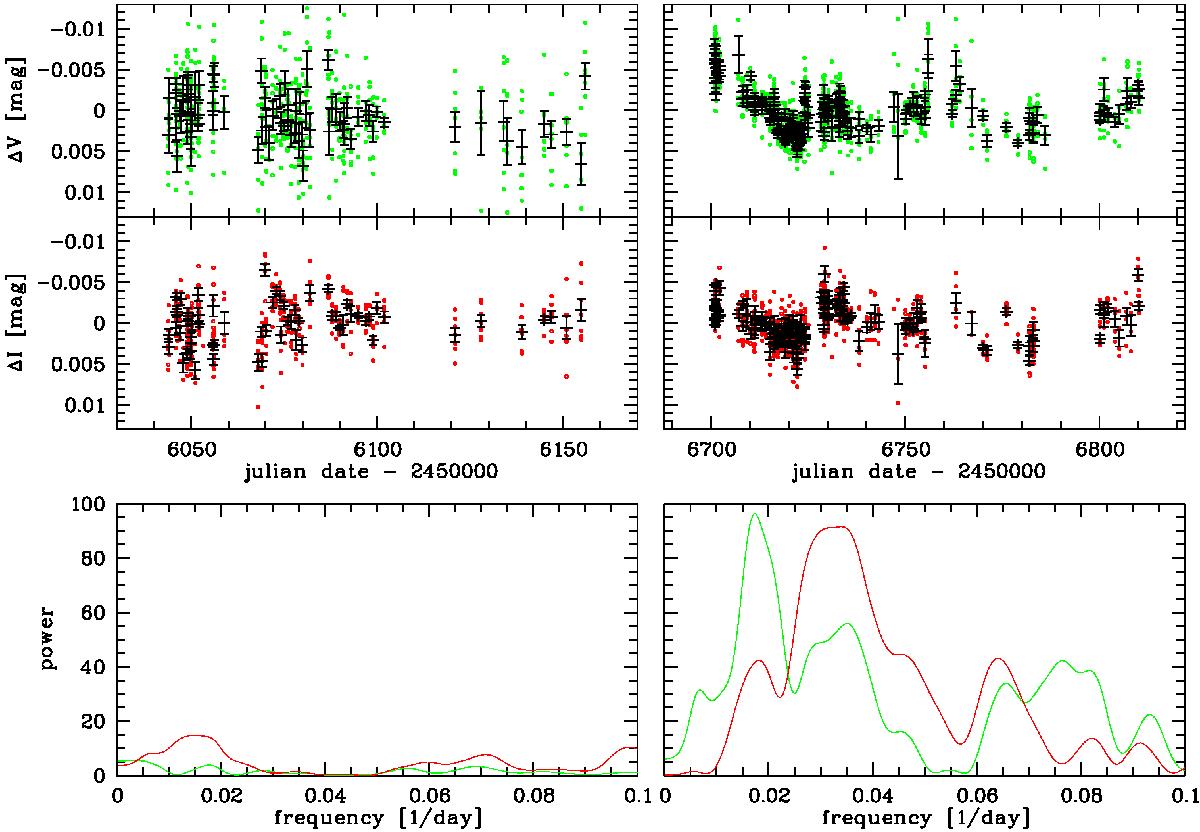
Upper panel: STELLA/WiFSIP differential V band photometry with the original data points in green and the average of the five exposures taken as a block given in black, with the error bars as the standard deviation divided by the square root of the number of averaged data points. On the left the observations from 2012 are shown, on the right the data from 2014. Middle panel: same as in the upper panel, here for the I-band photometry. Lower panel: the Lomb-Scargle periodogram for the V band data (green) and the I-band data (red), on the left for 2012, on right for 2014.
Current usage metrics show cumulative count of Article Views (full-text article views including HTML views, PDF and ePub downloads, according to the available data) and Abstracts Views on Vision4Press platform.
Data correspond to usage on the plateform after 2015. The current usage metrics is available 48-96 hours after online publication and is updated daily on week days.
Initial download of the metrics may take a while.