Fig. 4
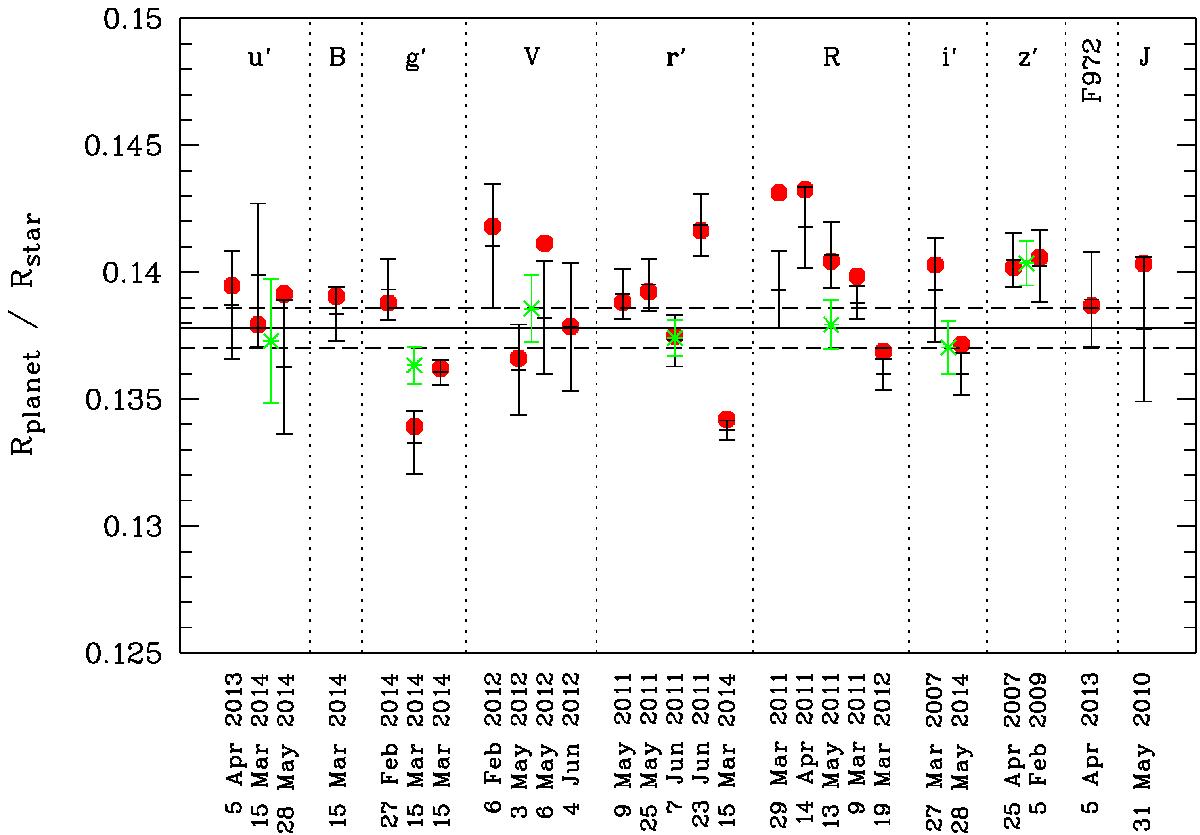
Planet-to-star radius ratio k for the individual transit light curves. Black crosses show k when the linear LDC u is a free-fit parameter, and red points show the same value when u is fixed to its theoretical value given in Table 5. The error bars of the latter are on average 20 percent smaller than the uncertainties of the former so are not shown here. Data points in green show the value of k for the simultaneous fit of multiple transits per filter. The horizontal line shows the globally derived value of k as given in Table 3 and its uncertainty in dashed lines.
Current usage metrics show cumulative count of Article Views (full-text article views including HTML views, PDF and ePub downloads, according to the available data) and Abstracts Views on Vision4Press platform.
Data correspond to usage on the plateform after 2015. The current usage metrics is available 48-96 hours after online publication and is updated daily on week days.
Initial download of the metrics may take a while.