Fig. 3
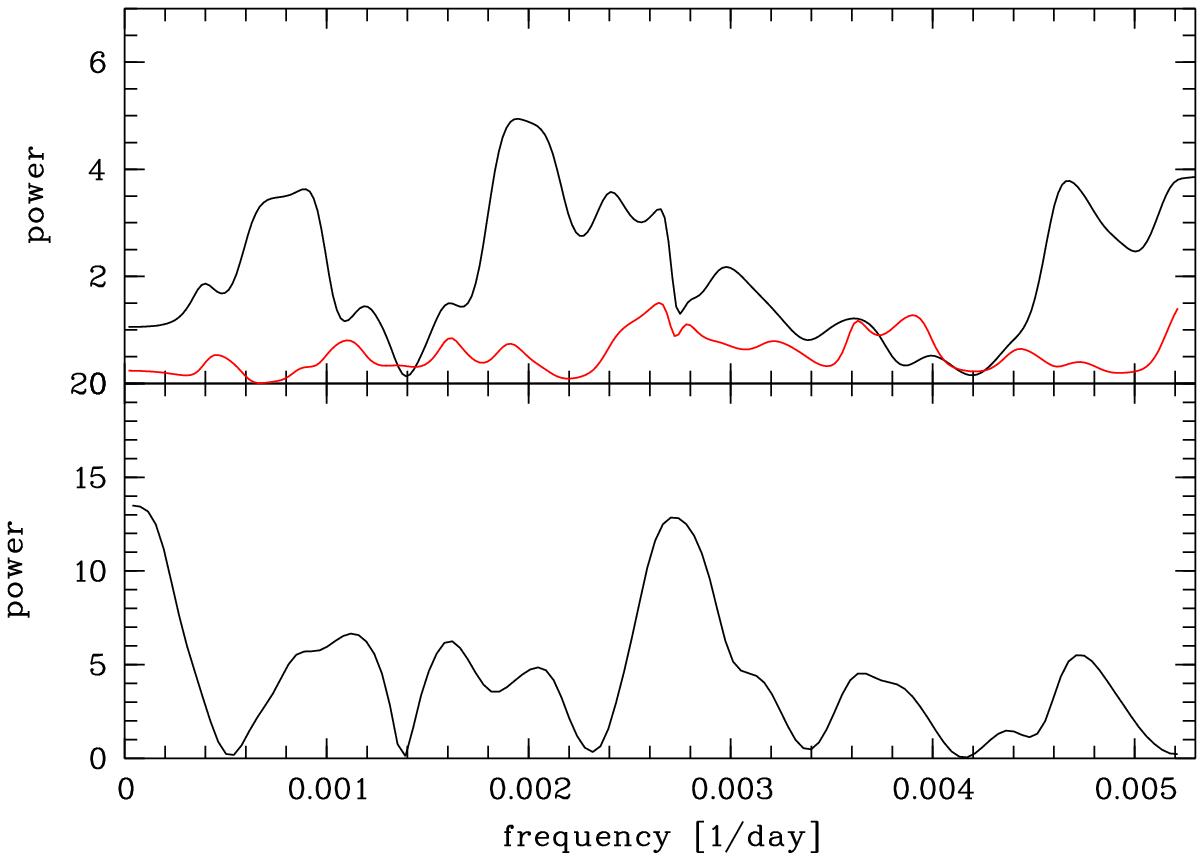
Upper panel: lomb-Scargle periodogram of the timing deviation from the linear ephemeris (O–C) when excluding the partial transits (black). A marginal signal can be seen at a frequency of ~0.0019 day-1. In comparison, the periodogram without the transit of March 19, 2012 (epoch = −8) is also shown (red). Lower panel: window function of the data set.
Current usage metrics show cumulative count of Article Views (full-text article views including HTML views, PDF and ePub downloads, according to the available data) and Abstracts Views on Vision4Press platform.
Data correspond to usage on the plateform after 2015. The current usage metrics is available 48-96 hours after online publication and is updated daily on week days.
Initial download of the metrics may take a while.