Fig. 7
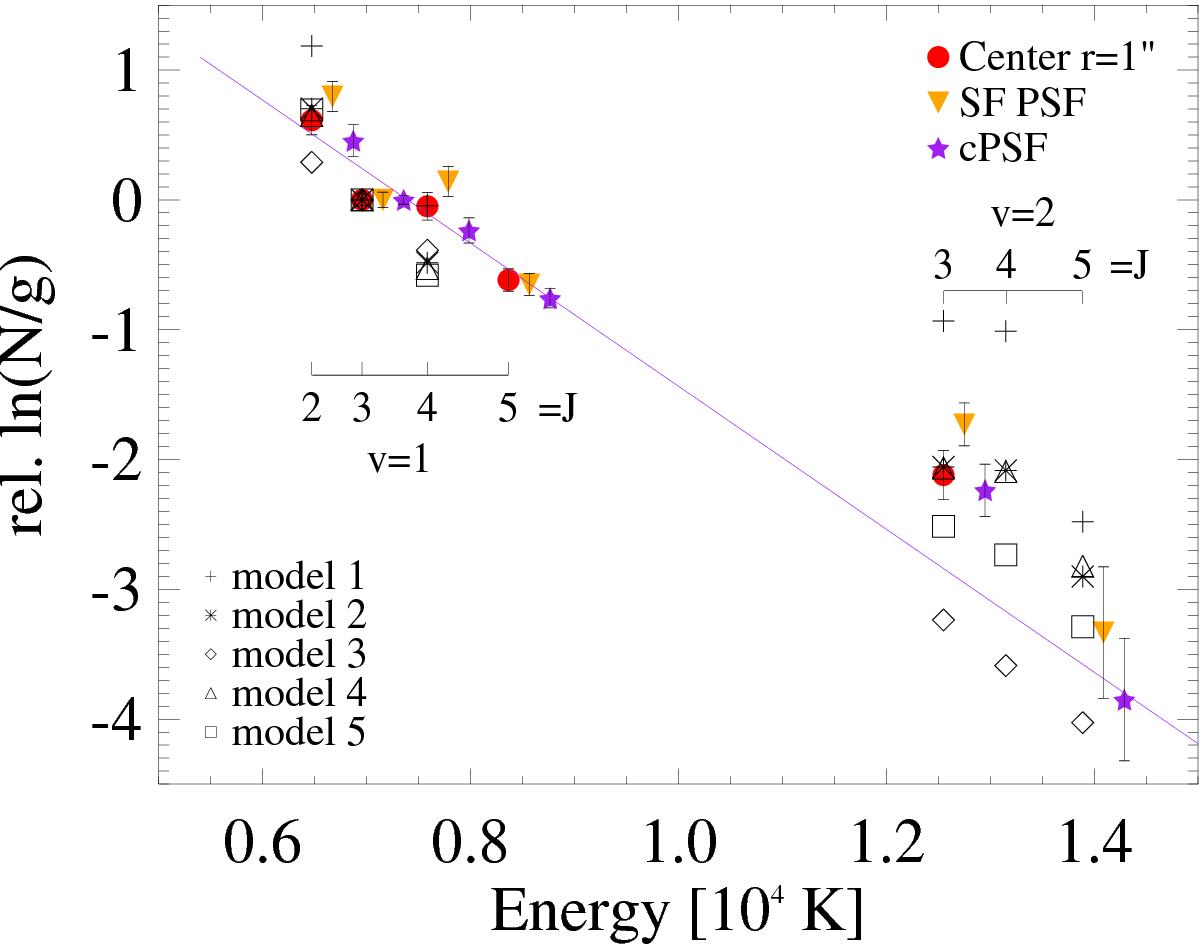
Molecular hydrogen level population diagram relative to the H2(1−0)S(1) transition. The column density N is given in [m-2]. The center r = 1″ region marks the energy of the level, the other regions are shifted for a better presentation in the plot. The models are for dense UV-excited gas taken from Davies et al. (2003). The linear fit is to the v = 1 levels of region cPSF which yields a kinetic excitation temperature of Texc ~ 1800 K.
Current usage metrics show cumulative count of Article Views (full-text article views including HTML views, PDF and ePub downloads, according to the available data) and Abstracts Views on Vision4Press platform.
Data correspond to usage on the plateform after 2015. The current usage metrics is available 48-96 hours after online publication and is updated daily on week days.
Initial download of the metrics may take a while.