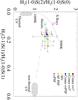
Fig. 6
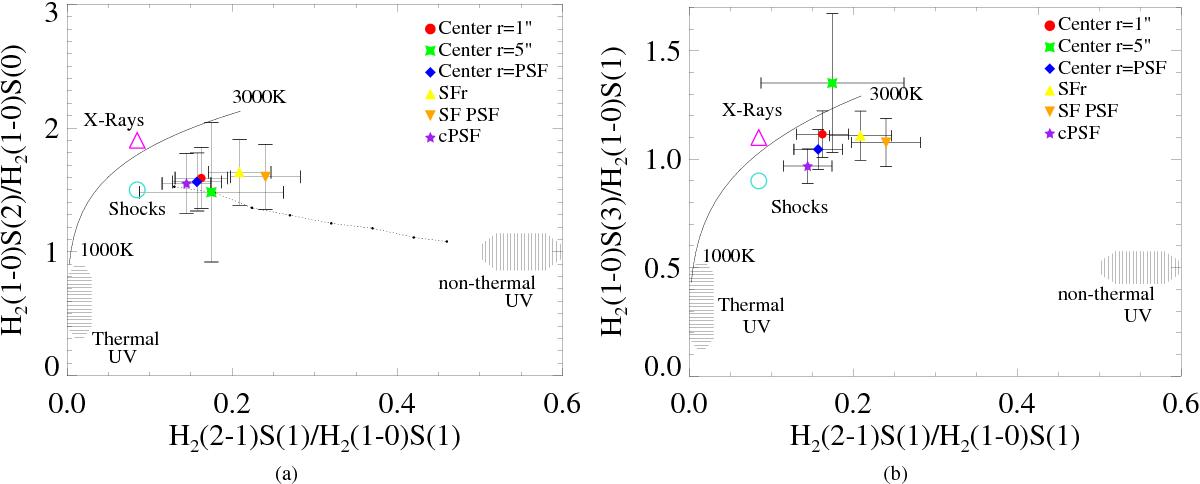
Molecular hydrogen line ratio diagrams. The ratios of H2(2−1)S(1)/H2(1−0)S(1) versus H2(1−0)S(2)/H2(1−0)S(0) are shown in a). The ratios of H2(2−1)S(1)/H2(1−0)S(1) versus H2(1−0)S(3)/H2(1−0)S(1) are shown in b). The curves represent the thermal emission at 1000−3000 K. Vertical stripes represent the region where models by Black & van Dishoeck (1987) predict non-thermal UV excitation. Horizontal stripes are thermal UV excitation models by Sternberg & Dalgarno (1989). The open, magenta triangle represents thermal X-ray models by Draine & Woods (1990) and the open, turquoise circle represents a shock model from Brand et al. (1989). The filled dark bullets connected with a dotted line in a) are the predicted line ratios from a mixture of thermal and low-density fluorescence models of Black & van Dishoeck (1987). The first bullet from the left represents 10% non-thermal and 90% thermal UV-fluorescence, the second 20% non-thermal and 80% thermal UV-fluorescence and so on.
Current usage metrics show cumulative count of Article Views (full-text article views including HTML views, PDF and ePub downloads, according to the available data) and Abstracts Views on Vision4Press platform.
Data correspond to usage on the plateform after 2015. The current usage metrics is available 48-96 hours after online publication and is updated daily on week days.
Initial download of the metrics may take a while.