Fig. 5
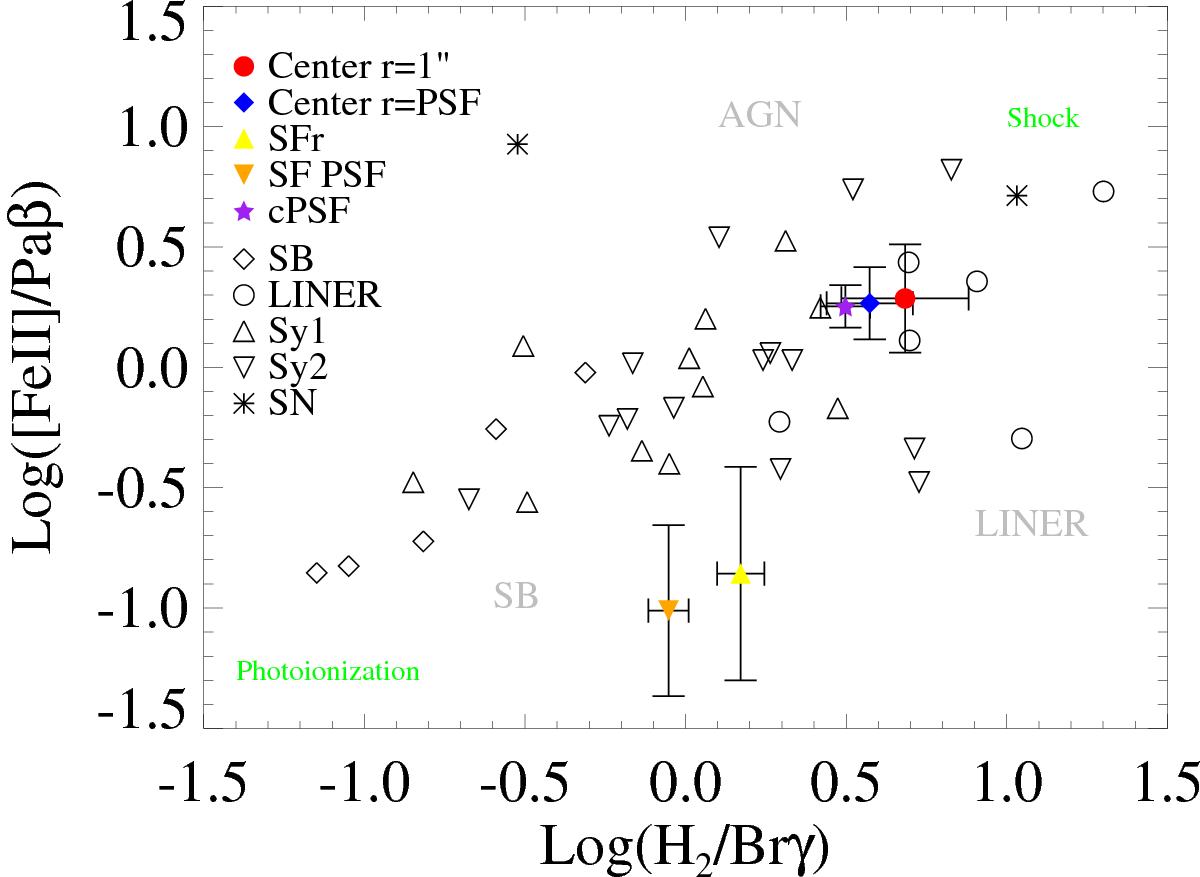
Diagnostic diagram of log [Fe ii] /Paβ and log H2/ Brγ for the central r = PSF, r = 1″ and the star formation region (SFr). The conversion factor of 0.744 was used for [Fe ii]λ1.644μm over [Fe ii]λ1.257μm (Nussbaumer & Storey 1988). For the conversion of Brγ to Paβ the case B ratio of 0.17 was used. Open symbols correspond to literature values from Larkin et al. (1998, LINER), Dale et al. (2004, SB), Rodríguez-Ardila et al. (2004, 2005, Sy1, Sy2).
Current usage metrics show cumulative count of Article Views (full-text article views including HTML views, PDF and ePub downloads, according to the available data) and Abstracts Views on Vision4Press platform.
Data correspond to usage on the plateform after 2015. The current usage metrics is available 48-96 hours after online publication and is updated daily on week days.
Initial download of the metrics may take a while.