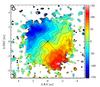
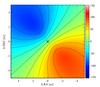
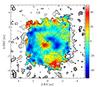
Fig. 13
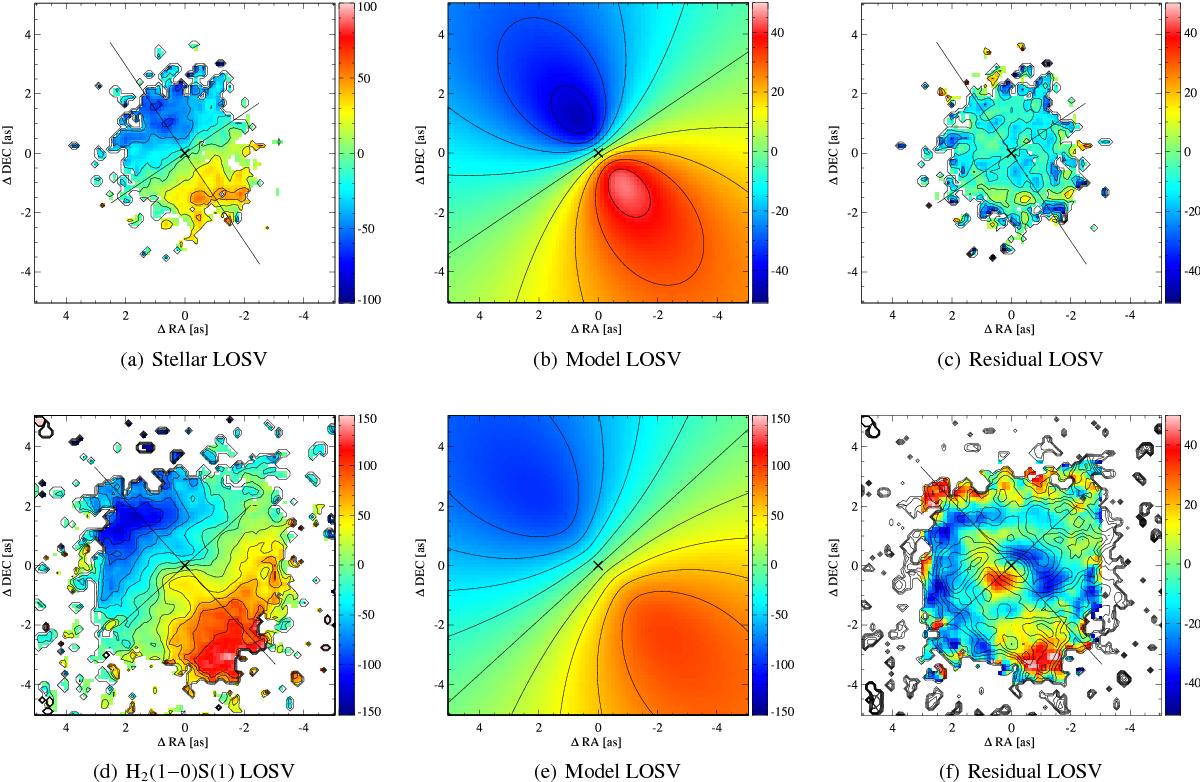
Top: stellar LOSV, fitted LOSV model and the subtracted residual in units of [km s-1]. Bottom: H2(1−0)S(1) LOSV, fitted LOSV model and the subtracted residual overlayed with contours of the EW map of H2(1−0)S(1) in units of [km s-1]. The EW map was overlayed to display the nuclear spiral onto the residual velocity field of the gas. The straight lines denote the orientation of the major and minor rotation axis as determined by the LOSV model. For more details, see Sect. 3.6.
Current usage metrics show cumulative count of Article Views (full-text article views including HTML views, PDF and ePub downloads, according to the available data) and Abstracts Views on Vision4Press platform.
Data correspond to usage on the plateform after 2015. The current usage metrics is available 48-96 hours after online publication and is updated daily on week days.
Initial download of the metrics may take a while.