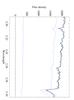
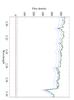
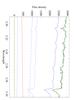
Fig. 10
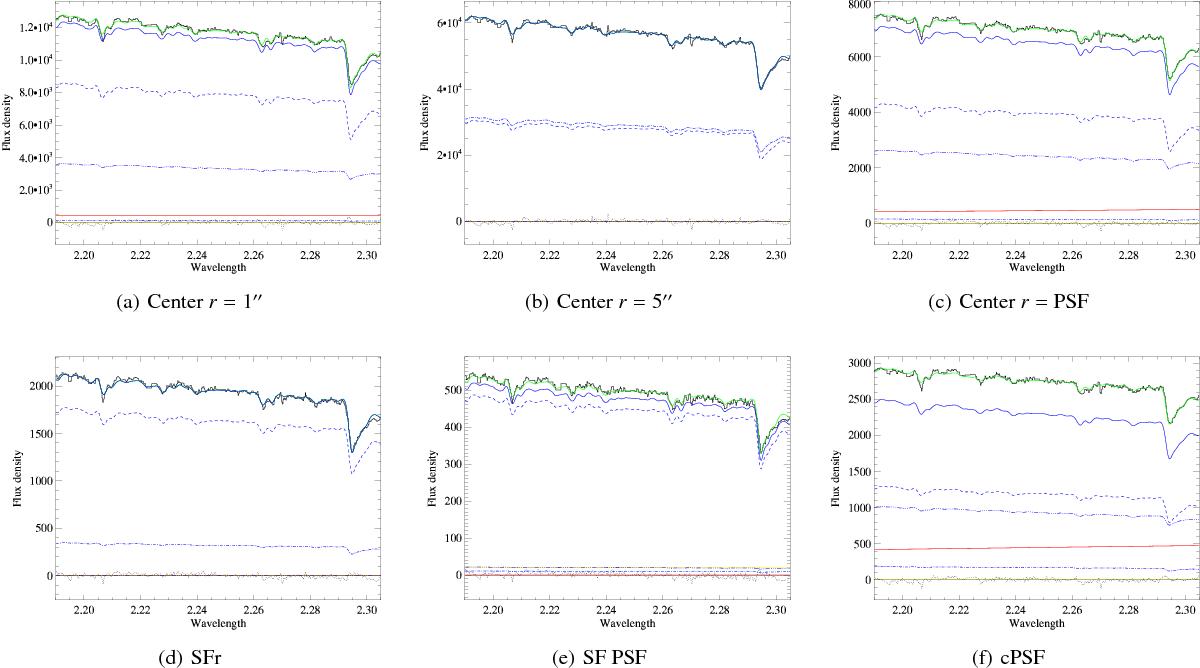
Continuum decomposition for six different regions. The axes are flux density [10-18 W m-2μm-1] versus wavelength [μm]. The components are: red curve: hot dust component; Yellow curve: power-law component; full blue curve: total stellar component; lined blue curve: M0III star; Line-dot blue curve: K3III star; triple-dot-lined blue curve: G5III star. The combined components curve is in green and the original input spectrum is in black. The dotted black curve around zero is the residual of spectrum minus combined curve. We note that the emission lines at λ2.223 μm and λ2.247 μm were masked.
Current usage metrics show cumulative count of Article Views (full-text article views including HTML views, PDF and ePub downloads, according to the available data) and Abstracts Views on Vision4Press platform.
Data correspond to usage on the plateform after 2015. The current usage metrics is available 48-96 hours after online publication and is updated daily on week days.
Initial download of the metrics may take a while.