| Issue |
A&A
Volume 582, October 2015
|
|
|---|---|---|
| Article Number | L10 | |
| Number of page(s) | 5 | |
| Section | Letters | |
| DOI | https://doi.org/10.1051/0004-6361/201527094 | |
| Published online | 14 October 2015 | |
Fingerprints of giant planets in the photospheres of Herbig stars⋆
1
Leiden Observatory,
PO Box 9513,
2300 RA
Leiden,
The Netherlands
e-mail:
This email address is being protected from spambots. You need JavaScript enabled to view it.
2
Université de Grenoble Alpes, IPAG, 38000
Grenoble,
France
3
CNRS, IPAG, 38000
Grenoble,
France
Received: 30 July 2015
Accepted: 9 September 2015
Abstract
Around 2% of all A stars have photospheres depleted in refractory elements. This is hypothesised to arise from gas being accreted more efficiently than dust, but the specific processes and the origin of the material – circum- or interstellar – are not known. The same depletion is seen in 30% of young, disk-hosting Herbig Ae/Be stars. We investigate whether the chemical peculiarity originates in a circumstellar disk. Using a sample of systems for which both the stellar abundances and the protoplanetary disk structure are known, we find that stars hosting warm, flaring group I disks typically have Fe, Mg and Si depletions of 0.5 dex compared to the solar-like abundances of stars hosting cold, flat group II disks. The volatile, C and O, abundances in both sets are identical. Group I disks are generally transitional, having radial cavities depleted in millimetre-sized dust grains, while those of group II are usually not. Thus we propose that the depletion of heavy elements emerges as Jupiter-like planets block the accretion of part of the dust, while gas continues to flow towards the central star. We calculate gas to dust ratios for the accreted material and find values consistent with models of disk clearing by planets. Our results suggest that giant planets of ~0.1 to 10 MJup are hiding in at least 30% of Herbig Ae/Be disks.
Key words: accretion, accretion disks / protoplanetary disks / planet-disk interactions / stars: variables: T Tauri, Herbig Ae/Be / stars: chemically peculiar / stars: abundances
Appendix A is available in electronic form at http://www.aanda.org
© ESO, 2015
1. Introduction
Chemically peculiar λBoö stars have a solar-like photospheric abundance of volatile elements (C, N, O) but are underabundant by up to a factor of 100 in refractory elements (e.g., Fe, Mg, Si). The peculiarity affects up to 2% of all late B through early F stars (e.g., Gray & Corbally 1998; Paunzen 2001). Among the young Herbig Ae/Be stars, which host protoplanetary disks, the fraction is at least 33% (Folsom et al. 2012).
Stars of spectral type late B through early F have radiative envelopes, and consequently their photosphere is mixed with the interior on timescales of ~1 Myr. This enables accreting material to dominate the photospheric composition for accretion rates as low as 10-13 M⊙yr-1 (Turcotte & Charbonneau 1993; Turcotte 2002). Because the λBoö depletion pattern matches that of diffuse interstellar gas, it has been linked to the accretion of material from the circum- or interstellar medium, with radiation pressure providing the mechanism that keeps dust from accreting while gas streams onto the star (Venn & Lambert 1990; Kamp & Paunzen 2002; Martínez-Galarza et al. 2009). Since radiation pressure should affect all systems, it has been unclear why only a fraction of intermediate-mass stars display the λBoö peculiarity.
Herbig Ae/Be stars are young B, A, and F stars that host a protoplanetary disk and are accreting (Herbig 1960; Waters & Waelkens 1998). Based on their spectral energy distributions, the disks are categorized as “group II” (cold, flat) and “group I” (warm, flaring; Meeus et al. 2001). A further distinction is made between disks showing emission from warm, small silicate grains (II, Ia) and those not showing such features (Ib). Initially, group I was thought to evolve to group II as dust particles grew and settled (Meeus et al. 2001; Dullemond & Dominik 2004a,b). The emerging view from recent debates is that group I disks are transitional, i.e., have radial cavities or gaps strongly depleted in millimetre-sized dust and perhaps gas (e.g., Keane et al. 2014; Maaskant et al. 2014; Banzatti & Pontoppidan 2015; Menu et al. 2015; van der Plas et al. 2015). As yet, no group II source is known to be a transition disk (TD), while all resolved TDs are group I sources.
Cavities and gaps in transitional disks may arise due to dust being trapped in the outer disk by giant planets (Whipple 1972; Barge & Sommeria 1995; Rice et al. 2006; Pinilla et al. 2012; Zhu et al. 2012), by gas and dust clearing owing to photoevaporation (Alexander et al. 2006a,b, 2014; Owen et al. 2011, 2012), or by the accumulation of gas and dust at the outer edge of a region with low ionization (Regály et al. 2012; Flock et al. 2015). The dominant mechanism should determine the volatile (gas) to refractory (dust) elemental ratios in the accretion columns that channel material onto the stellar photosphere. Most Herbig Ae/Be stars accrete at rates comparable to, or higher than, T Tauri stars (10-9−10-6 M⊙yr-1; Garcia Lopez et al. 2006; Donehew & Brittain 2011; Pogodin et al. 2012). We investigate whether stellar abundances correlate with disk properties, as might be expected from the above.
2. Data
Our sample, presented in Table A.1, consists of the overlap between the stellar abundance surveys and the compilation of disks described below. Metallicities or disk classifications for a few individual sources were added from the literature, but in this regard the sample is certainly not complete.
2.1. The elemental abundances
We adopt the photospheric abundances from Acke & Waelkens (2004) and Folsom et al. (2012). For overlapping sources, the surveys are largely consistent, but we adopt the Folsom et al. values as the study is more consistent in the stellar parameter determination. For some Acke & Waelkens sources, we used values based on the ionization state with the largest number of analyzed lines. Some stars in the abundance studies host debris and not protoplanetary disks and were excluded. The abundances for HD 100546 are from Kama et al. (2015) and for HD 34282 from Merín et al. (2004). HD 101412 was identified as a λBoö star by Cowley et al. (2010), we use newer abundances from Folsom et al. (2012). The solar abundances shown in Fig. 1 are from Asplund et al. (2009). Values for the warm diffuse interstellar gas are from Savage & Sembach (1996).
2.2. Properties of the disks
Most of the disk group classifications are from Maaskant et al. (2014). The references for radial disk cavities and gaps, accretion rates, stellar spectral types, and ages are given in Table A.1. HD 101412 is a λBoö star with a flat, cold dust disk consistent with a group II disk, but has a flaring, warm gas disk that is more reminiscent of group I systems (Fedele et al. 2008; van der Plas et al. 2008). We have classified it as group I or transitional, because it is clearly not a pure group II source. HD 245185 is the only remaining massive dust disk in the 5 Myr old λOri cluster and, based on CO observations, has a very low gas-to-dust mass ratio (Ansdell et al. 2015). HD 179218 is a distant (d = 244 pc) group I source that shows evidence of a characteristic dust emission radius that is larger than for group II sources, although a cavity has not definitively been resolved (Leinert et al. 2004).
 |
Fig. 1 Elemental abundances in the photospheres of Herbig stars hosting group I (transitional/TD, open symbols) and group II (filled symbols) disks. The sun and the warm diffuse interstellar medium are shown in red. The full Herbig samples (circles) are shown, as are their medians with sample standard deviations (diamonds with bars). |
3. Results
Within our sample, all but two group I systems are confirmed to be transitional, with a large-scale reduction in the surface density of millimetre-size dust in the inner disk. As a working hypothesis, we consider the group I and transitional classifications to be identical (I/TD). We do not employ a quantitative cutoff between stars without and with λBoö abundance patterns, although some of the stars in the sample display prominent λBoö anomalies. Rather, we separate the sources into group I and II disk hosts, and compare the stellar abundances between these subsets.
Figure 1 shows the photospheric abundances of two volatile elements (C and O) and three rock-forming elements (Fe, Mg, and Si) for the median and full sample of group I/TD and group II disk hosting stars. The solar photospheric abundances and those of the warm diffuse interstellar medium are given for comparison. The median elemental abundances are summarized in Table 1. The medians for the group II disk host stars are solar, while the medians for the group I/TD are solar-like for the volatiles, but depleted from solar by 0.5 dex for all refractory elements. The medians are unchanged if we exclude the Acke & Waelkens sample – all log 10(X/H) values change by ≤0.03, except Mg/H which increases by 0.13 for group II.
Only two group II sources, HD 142666 and HD 144432, have strongly sub-solar refractory element abundances. Interferometric observations reveal radial gaps on (sub-)au scales in both (Chen et al. 2012; Schegerer et al. 2013; Menu et al. 2015). They are thus small-scale transitional disks with outer disks similar to group II sources. The group II/I unclear source HD 101412 – for which we adopted group I – has a narrow ring of CO emission near the dust sublimation zone, which is also indicative of small-scale radial structure (Cowley et al. 2012). The disks around HD 101412, HD 142666, and HD 144432 all have large radial variations in surface density at ≲ 1 au, with host stars depleted in refractory elements. As noted by Currie (2010), such systems may probe the earliest stages of disk clearing.
Median log 10(X/H) abundances and sample standard deviations (scatter within the subset) for group I and II disk host stars.
3.1. The gas-to-dust ratio in the inner disk
Group II disks have no major depletion of dust or gas in their inner regions, while group I sources have surface density reduction factors of 10-1 to ≳10-6 for dust, and none to 10-5 for gas (Bruderer et al. 2014; Zhang et al. 2014; Perez et al. 2015; van der Marel et al. 2015). A gap-opening giant planet reduces the surface density of large (millimetre-scale) dust by a larger factor than that of the gas (Rice et al. 2006; Zhu et al. 2012). This offers a natural explanation for a decreased photospheric abundance of refractory elements, because a large portion of the dust mass can remain trapped farther out in the disk while gas and smaller grains continue to accrete. We now consider the photospheric composition of Herbig stars as a proxy for the gas-to-dust ratio in the accreting material. The solar composition corresponds to a gas-to-dust ratio of 100. Noting the abundance of volatiles (C, O) as V/H and those of refractories (Fe, Mg, Si) as R/H, we express the Δg/d ratio in an inner disk feeding an accretion flow as  (1)where V/H⋆ and R/H⋆ are the abundances in the host star. The results are shown in Fig. 2 for systems where at least one volatile and one refractory element has been measured.
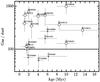 |
Fig. 2 The gas-to-dust ratios in the accreting material of group I (open circles) and group II (filled) disks, calculated from the stellar abundances with Eq. (1). |
3.1.1. HD 100546
The highest inner disk gas-to-dust ratio in our sample, 1000, is found for HD 100546. We compare this photosphere-based value to the two-planet hydrodynamic disk model from Walsh et al. (2014) and Pinilla et al. (2015), and the physical-chemical disk model from Kama et al. (2015). At 10 Myr, the age of the system, the hydrodynamic model yields Δg/d ≈ 1000 inside 20 au. While this model was not configured to model the accretion zone, the gas to dust ratio of the inner cavity provides a zeroth-order approximation for the accreting material. The model from Kama et al. reproduces the spectral energy distribution and a range of emission lines, and allows for Δg/d = 1000 in the inner disk. The consistency of all three approaches suggests that the photospheric abundances reflect the inner disk material.
4. Discussion
4.1. Evidence for giant planets
The depletion of refractory elements in group I host stars is consistent with giant planets interacting with their disks. A planet with a mass ≲0.1 MJup does not substantially alter the surface density of dust or gas, with Δg/d ≈ 100 at the planet position (e.g., Dong et al. 2015). A planet in the mass range 1 MJup ≲ Mp ≲ 10 MJup decreases the surface density of millimetre-sized dust more than that of the gas, with Δg/d ≈ 1000−10 000 (Pinilla et al. 2012, Fig. 6). A more massive planet, Mp ≳ 10−15 MJup, substantially decreases the surface densities of both the dust and the gas. Since the observations require a larger decrease in the dust than the gas in the accreted material, we propose that the λBoö-like Herbig stars host planets in the ≳ 0.1 to 10 MJup range, with the exact limits depending on the disk temperature and viscosity. Photoevaporation would deplete gas at least as efficiently as dust and is thus not consistent with the λBoö sources. We illustrate the typical group II and I inner disk structures and their relation to stellar photospheric abundances in Fig. 3.
Figure 1 shows that while the underabundance of refractory elements in group I/TD host stars is significant, not all are strong λBoö stars, and some have solar-like abundances. This may be related to the presence of an inner disk extending to the accretion radius (“pre-transitional” disks, see Espaillat et al. 2014) and still containing enough mass in gas and dust to not be affected by the depletion of large grains in the gap containing the planet. Alternatively, such disks may host companions with masses ≳10 MJup, which would block the accretion of both gas and dust from the outer disk. The stars in our sample have high accretion rates, which favours the massive inner disk scenario.
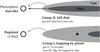 |
Fig. 3 Stellar photospheric abundances and the inner disk gas and dust distribution for typical group I (transitional) and II systems. |
4.2. The occurrence rates of transitional disks, λBoö anomalies, and planets
Based on a large homogeneous study of T Tauri stars with the SMA interferometer, Andrews et al. (2011) found an occurrence rate of transitional disks of >26%. As a first guess, we adopted this value for the Herbig Ae/Be systems. If the λBoö anomalies are due to the filtration of dust in transitional disks, we expect a similar occurrence rate of λBoö anomalies. Among the Herbig sample of Folsom et al. (2012), the λBoö occurrence rate is 33%, which is consistent with the estimated transitionality fraction.
If the correlation of refractory depletion and disk structure is indeed due to giant planets, and if the transitional phase is shorter than the disk lifetime, the ~30% occurrence rate of transitionality and λBoö anomalies is a lower limit of the fraction of Herbig stars hosting giant planets in the 0.1–10 MJup range. Current exoplanet surveys are not complete down to 0.1 MJup at Jupiter-like orbits. In the 3–14 MJup mass range, the occurrence rate of planets at 5–320 au around A stars is 3 to 30% at 95% confidence (Vigan et al. 2012), while the ≥ 4 MJup planet occurrence rate at 59–460 au for B and A stars is ≤ 20% (Nielsen et al. 2013). The radial velocity survey of Reffert et al. (2015) found an occurrence rate of ~30% for planets ≳ 1 MJup around intermediate-mass stars. This peaks towards super-solar metallicity ([Fe/H] ≳ 0.2) and declines for stars more massive than ~2.5 M⊙. Allowing for undetected lower-mass planets, the occurrence rate of transitionality and λBoö anomalies is consistent with the giant planet population around A stars. The fact that the radial velocity planet occurrence rate peaks at a bulk stellar metallicity [Fe/H] ≳ 0.2 suggests that λBoö-like depletions typically decrease photospheric metallicities by more than 0.5 dex.
4.3. The longevity of B, A, F star disks
A number of the group I disks studied in this paper are older than the canonical lifetime of 2–6 Myr for massive gas-dust disks (Haisch et al. 2001). Several sources are in the 10 Myr regime. At such ages, many systems already show low emission levels consistent with debris disks (e.g., Hardy et al. 2015; Wyatt et al. 2015). This is particularly surprising since A stars are thought to lose their disks faster (Ribas et al. 2015) and suggests that the giant planet systems responsible for clearing large portions of the inner disk may contribute to disk longevity by trapping material in the outer disk. It has been suggested that ~30% of field stars retain their gas disks for 10 Myr (Pfalzner et al. 2014).
The frequency of the λBoö phenomenon among main sequence B, A, and F type stars is ≈ 2% (Gray & Corbally 1998). These stars likely do not host massive protoplanetary disks and their λBoö peculiarity should disappear on a ~1 Myr timescale. However, λBoö peculiarities correlate with debris disks (King & Patten 1992; Draper et al. 2015). This suggests that debris disks around early-type stars generally retain or produce large amounts of volatile-rich gas. We note that HR 8799, a 30 Myr old intermediate-mass that hosts four giant planets of 5−7 MJup at large orbits, as well as a multi-component debris disk, is a λBoö peculiar star (Marois et al. 2008, 2010; Su et al. 2009; Murphy et al. 2015). The photospheric abundances of early-type stars are a new window into the long-term evolution of protoplanetary gas disks.
5. Conclusions
We present a correlation between the presence of a large radial cavity or gap in a protoplanetary disk and the depletion of refractory elements in the photosphere of the host star. Such a depletion in intermediate-mass stars, known as the λBoö peculiarity, has been known for decades but has been unexplained until now. We propose that the trapping of large dust grains in the outer disk by giant planets provides a natural mechanism for increasing the gas-to-dust ratio of the accreted material, suggesting that as many as ~30% of Herbig Ae/Be stars harbour giant planets.
-
1.
A typical late-B through early-F star hosting a group I or transitional disk is depleted in rock-forming elements (Fe, Mg, Si) by 0.5 dex compared to solar and group II host abundances.
-
2.
All group II disk hosts in our sample have solar-like stellar abundances. The two exceptional systems, HD 142666 and HD 144432, have small-scale radial dust gaps.
-
3.
The depletion of rock-forming elements in stars hosting group I disks is likely due to giant planets which trap large dust grains in the outer disk. The diversity of disk structures and planet masses explains why λBoö-like stars have a range of depletions, rather than clustering at particular values.
-
4.
A deficiency of rock-forming elements in the photosphere of a disk-hosting B, A or F star implies the presence of a radial dust cavity or gap, and a giant planet.
-
5.
Most as-yet uncharacterised central stars of transitional Herbig Ae/Be disk systems will likely be found to have a low abundance of rock-forming elements.
Online material
Appendix A: Details of the sample
Systems studied in this paper.
Acknowledgments
Astrochemistry in Leiden is supported by the Netherlands Research School for Astronomy (NOVA), by a Royal Netherlands Academy of Arts and Sciences (KNAW) professor prize, and by the European Union A-ERC grant 291141 CHEMPLAN. C.P.F. was supported by the French grant ANR 2011 Blanc SIMI5-6 020 01 “Toupies: Towards understanding the spin evolution of stars”.
References
- Acke, B., & Waelkens, C. 2004, A&A, 427, 1009 [NASA ADS] [CrossRef] [EDP Sciences] [Google Scholar]
- Alexander, R. D., Clarke, C. J., & Pringle, J. E. 2006a, MNRAS, 369, 216 [NASA ADS] [CrossRef] [Google Scholar]
- Alexander, R. D., Clarke, C. J., & Pringle, J. E. 2006b, MNRAS, 369, 229 [NASA ADS] [CrossRef] [Google Scholar]
- Alexander, R., Pascucci, I., Andrews, S., Armitage, P., & Cieza, L. 2014, Protostars and Planets VI, 475 [Google Scholar]
- Andrews, S. M., Wilner, D. J., Espaillat, C., et al. 2011, ApJ, 732, 42 [NASA ADS] [CrossRef] [Google Scholar]
- Ansdell, M., Williams, J. P., & Cieza, L. A. 2015, ApJ, 806, 221 [NASA ADS] [CrossRef] [Google Scholar]
- Asplund, M., Grevesse, N., Sauval, A. J., & Scott, P. 2009, ARA&A, 47, 481 [NASA ADS] [CrossRef] [Google Scholar]
- Banzatti, A., & Pontoppidan, K. M. 2015, ApJ, 809, 167 [NASA ADS] [CrossRef] [Google Scholar]
- Barge, P., & Sommeria, J. 1995, A&A, 295, L1 [NASA ADS] [Google Scholar]
- Bruderer, S., van der Marel, N., van Dishoeck, E. F., & van Kempen, T. A. 2014, A&A, 562, A26 [NASA ADS] [CrossRef] [EDP Sciences] [Google Scholar]
- Chen, L., Kreplin, A., Wang, Y., et al. 2012, A&A, 541, A104 [NASA ADS] [CrossRef] [EDP Sciences] [Google Scholar]
- Collins, K. A., Grady, C. A., Hamaguchi, K., et al. 2009, ApJ, 697, 557 [NASA ADS] [CrossRef] [Google Scholar]
- Cowley, C. R., Hubrig, S., González, J. F., & Savanov, I. 2010, A&A, 523, A65 [NASA ADS] [CrossRef] [EDP Sciences] [Google Scholar]
- Cowley, C. R., Hubrig, S., Castelli, F., & Wolff, B. 2012, A&A, 537, L6 [NASA ADS] [CrossRef] [EDP Sciences] [Google Scholar]
- Currie, T. 2010, ArXiv e-prints [arXiv:1002.1715] [Google Scholar]
- Donehew, B., & Brittain, S. 2011, AJ, 141, 46 [NASA ADS] [CrossRef] [Google Scholar]
- Dong, R., Zhu, Z., & Whitney, B. 2015, ApJ, 809, 93 [NASA ADS] [CrossRef] [Google Scholar]
- Draper, Z. H., Matthews, B. C., Kennedy, G. M., et al. 2015, MNRAS, submitted [Google Scholar]
- Dullemond, C. P., & Dominik, C. 2004a, A&A, 417, 159 [NASA ADS] [CrossRef] [EDP Sciences] [Google Scholar]
- Dullemond, C. P., & Dominik, C. 2004b, A&A, 421, 1075 [NASA ADS] [CrossRef] [EDP Sciences] [Google Scholar]
- Espaillat, C., Muzerolle, J., Najita, J., et al. 2014, Protostars and Planets VI, 497 [Google Scholar]
- Fedele, D., van den Ancker, M. E., Acke, B., et al. 2008, A&A, 491, 809 [NASA ADS] [CrossRef] [EDP Sciences] [MathSciNet] [Google Scholar]
- Flock, M., Ruge, J. P., Dzyurkevich, N., et al. 2015, A&A, 574, A68 [NASA ADS] [CrossRef] [EDP Sciences] [Google Scholar]
- Folsom, C. P., Bagnulo, S., Wade, G. A., et al. 2012, MNRAS, 422, 2072 [NASA ADS] [CrossRef] [MathSciNet] [Google Scholar]
- GarciaLopez, R., Natta, A., Testi, L., & Habart, E. 2006, A&A, 459, 837 [NASA ADS] [CrossRef] [EDP Sciences] [Google Scholar]
- Gray, R. O., & Corbally, C. J. 1998, AJ, 116, 2530 [NASA ADS] [CrossRef] [Google Scholar]
- Haisch, Jr., K. E., Lada, E. A., & Lada, C. J. 2001, ApJ, 553, L153 [NASA ADS] [CrossRef] [Google Scholar]
- Hardy, A., Caceres, C., Schreiber, M. R., et al. 2015, A&A, in press, DOI: 10.1051/0004-6361/201526504 [Google Scholar]
- Herbig, G. H. 1960, ApJS, 4, 337 [NASA ADS] [CrossRef] [Google Scholar]
- Holmberg, J., Nordström, B., & Andersen, J. 2009, A&A, 501, 941 [NASA ADS] [CrossRef] [EDP Sciences] [Google Scholar]
- Isella, A., Natta, A., Wilner, D., Carpenter, J. M., & Testi, L. 2010, ApJ, 725, 1735 [NASA ADS] [CrossRef] [Google Scholar]
- Kama, M., Bruderer, S., van Dishoeck, E. F., et al. 2015, A&A, submitted [Google Scholar]
- Kamp, I., & Paunzen, E. 2002, MNRAS, 335, L45 [NASA ADS] [CrossRef] [Google Scholar]
- Keane, J. T., Pascucci, I., Espaillat, C., et al. 2014, ApJ, 787, 153 [NASA ADS] [CrossRef] [Google Scholar]
- Khalafinejad, S., Maaskant, K. M., Marinas, N., et al. 2015, A&A, accepted [Google Scholar]
- King, J. R., & Patten, B. M. 1992, MNRAS, 256, 571 [NASA ADS] [CrossRef] [Google Scholar]
- Leinert, C., van Boekel, R., Waters, L. B. F. M., et al. 2004, A&A, 423, 537 [NASA ADS] [CrossRef] [EDP Sciences] [Google Scholar]
- Maaskant, K. M., Honda, M., Waters, L. B. F. M., et al. 2013, A&A, 555, A64 [NASA ADS] [CrossRef] [EDP Sciences] [Google Scholar]
- Maaskant, K. M., Min, M., Waters, L. B. F. M., & Tielens, A. G. G. M. 2014, A&A, 563, A78 [NASA ADS] [CrossRef] [EDP Sciences] [Google Scholar]
- Manoj, P., Bhatt, H. C., Maheswar, G., & Muneer, S. 2006, ApJ, 653, 657 [NASA ADS] [CrossRef] [Google Scholar]
- Marois, C., Macintosh, B., Barman, T., et al. 2008, Science, 322, 1348 [NASA ADS] [CrossRef] [PubMed] [Google Scholar]
- Marois, C., Zuckerman, B., Konopacky, Q. M., Macintosh, B., & Barman, T. 2010, Nature, 468, 1080 [NASA ADS] [CrossRef] [PubMed] [Google Scholar]
- Martínez-Galarza, J. R., Kamp, I., Su, K. Y. L., et al. 2009, ApJ, 694, 165 [NASA ADS] [CrossRef] [Google Scholar]
- Meeus, G., Waters, L. B. F. M., Bouwman, J., et al. 2001, A&A, 365, 476 [NASA ADS] [CrossRef] [EDP Sciences] [Google Scholar]
- Menu, J., van Boekel, R., Henning, T., et al. 2015, A&A, 581, A107 [NASA ADS] [CrossRef] [EDP Sciences] [Google Scholar]
- Merín, B., Montesinos, B., Eiroa, C., et al. 2004, A&A, 419, 301 [NASA ADS] [CrossRef] [EDP Sciences] [Google Scholar]
- Murphy, S. J., Corbally, C. J., Gray, R. O., et al. 2015, PASA, submitted [arXiv:1508.03633] [Google Scholar]
- Nielsen, E. L., Liu, M. C., Wahhaj, Z., et al. 2013, ApJ, 776, 4 [NASA ADS] [CrossRef] [Google Scholar]
- Owen, J. E., Ercolano, B., & Clarke, C. J. 2011, MNRAS, 412, 13 [NASA ADS] [CrossRef] [Google Scholar]
- Owen, J. E., Clarke, C. J., & Ercolano, B. 2012, MNRAS, 422, 1880 [NASA ADS] [CrossRef] [Google Scholar]
- Paunzen, E. 2001, A&A, 373, 633 [Google Scholar]
- Perez, S., Casassus, S., Ménard, F., et al. 2015, ApJ, 798, 85 [NASA ADS] [CrossRef] [Google Scholar]
- Pfalzner, S., Steinhausen, M., & Menten, K. 2014, ApJ, 793, L34 [NASA ADS] [CrossRef] [Google Scholar]
- Piétu, V., Guilloteau, S., & Dutrey, A. 2005, A&A, 443, 945 [NASA ADS] [CrossRef] [EDP Sciences] [Google Scholar]
- Pinilla, P., Benisty, M., & Birnstiel, T. 2012, A&A, 545, A81 [NASA ADS] [CrossRef] [EDP Sciences] [Google Scholar]
- Pinilla, P., Birnstiel, T., & Walsh, C. 2015, A&A, 580, A105 [NASA ADS] [CrossRef] [EDP Sciences] [Google Scholar]
- Pogodin, M. A., Hubrig, S., Yudin, R. V., et al. 2012, Astron. Nachr., 333, 594 [NASA ADS] [CrossRef] [Google Scholar]
- Reffert, S., Bergmann, C., Quirrenbach, A., Trifonov, T., & Künstler, A. 2015, A&A, 574, A116 [NASA ADS] [CrossRef] [EDP Sciences] [Google Scholar]
- Regály, Z., Juhász, A., Sándor, Z., & Dullemond, C. P. 2012, MNRAS, 419, 1701 [NASA ADS] [CrossRef] [Google Scholar]
- Ribas, Á., Bouy, H., & Merín, B. 2015, A&A, 576, A52 [NASA ADS] [CrossRef] [EDP Sciences] [Google Scholar]
- Rice, W. K. M., Lodato, G., Pringle, J. E., Armitage, P. J., & Bonnell, I. A. 2006, MNRAS, 372, L9 [NASA ADS] [CrossRef] [Google Scholar]
- Savage, B. D., & Sembach, K. R. 1996, ARA&A, 34, 279 [NASA ADS] [CrossRef] [Google Scholar]
- Schegerer, A. A., Ratzka, T., Schuller, P. A., et al. 2013, A&A, 555, A103 [NASA ADS] [CrossRef] [EDP Sciences] [Google Scholar]
- Su, K. Y. L., Rieke, G. H., Stapelfeldt, K. R., et al. 2009, ApJ, 705, 314 [NASA ADS] [CrossRef] [Google Scholar]
- Turcotte, S. 2002, ApJ, 573, L129 [NASA ADS] [CrossRef] [Google Scholar]
- Turcotte, S., & Charbonneau, P. 1993, ApJ, 413, 376 [NASA ADS] [CrossRef] [Google Scholar]
- van den Ancker, M. E., The, P. S., Tjin A Djie, H. R. E., et al. 1997, A&A, 324, L33 [NASA ADS] [Google Scholar]
- van der Marel, N., van Dishoeck, E. F., Bruderer, S., Pérez, L., & Isella, A. 2015, A&A, 579, A106 [NASA ADS] [CrossRef] [EDP Sciences] [Google Scholar]
- van der Plas, G., van den Ancker, M. E., Fedele, D., et al. 2008, A&A, 485, 487 [NASA ADS] [CrossRef] [EDP Sciences] [Google Scholar]
- van der Plas, G., van den Ancker, M. E., Waters, L. B. F. M., & Dominik, C. 2015, A&A, 574, A75 [NASA ADS] [CrossRef] [EDP Sciences] [Google Scholar]
- Venn, K. A., & Lambert, D. L. 1990, ApJ, 363, 234 [NASA ADS] [CrossRef] [Google Scholar]
- Vigan, A., Patience, J., Marois, C., et al. 2012, A&A, 544, A9 [NASA ADS] [CrossRef] [EDP Sciences] [Google Scholar]
- Walsh, C., Juhász, A., Pinilla, P., et al. 2014, ApJ, 791, L6 [NASA ADS] [CrossRef] [Google Scholar]
- Waters, L. B. F. M., & Waelkens, C. 1998, ARA&A, 36, 233 [NASA ADS] [CrossRef] [Google Scholar]
- Whipple, F. L. 1972, in From Plasma to Planet, ed. A. Elvius, 211 [Google Scholar]
- Wyatt, M. C., Panić, O., Kennedy, G. M., & Matrà, L. 2015, Ap&SS, 357, 103 [NASA ADS] [CrossRef] [Google Scholar]
- Zhang, K., Isella, A., Carpenter, J. M., & Blake, G. A. 2014, ApJ, 791, 42 [NASA ADS] [CrossRef] [Google Scholar]
- Zhu, Z., Nelson, R. P., Dong, R., Espaillat, C., & Hartmann, L. 2012, ApJ, 755, 6 [NASA ADS] [CrossRef] [Google Scholar]
All Tables
Median log 10(X/H) abundances and sample standard deviations (scatter within the subset) for group I and II disk host stars.
All Figures
|
Fig. 1 Elemental abundances in the photospheres of Herbig stars hosting group I (transitional/TD, open symbols) and group II (filled symbols) disks. The sun and the warm diffuse interstellar medium are shown in red. The full Herbig samples (circles) are shown, as are their medians with sample standard deviations (diamonds with bars). |
| In the text | |
|
Fig. 2 The gas-to-dust ratios in the accreting material of group I (open circles) and group II (filled) disks, calculated from the stellar abundances with Eq. (1). |
| In the text | |
|
Fig. 3 Stellar photospheric abundances and the inner disk gas and dust distribution for typical group I (transitional) and II systems. |
| In the text | |
Current usage metrics show cumulative count of Article Views (full-text article views including HTML views, PDF and ePub downloads, according to the available data) and Abstracts Views on Vision4Press platform.
Data correspond to usage on the plateform after 2015. The current usage metrics is available 48-96 hours after online publication and is updated daily on week days.
Initial download of the metrics may take a while.