Fig. 1
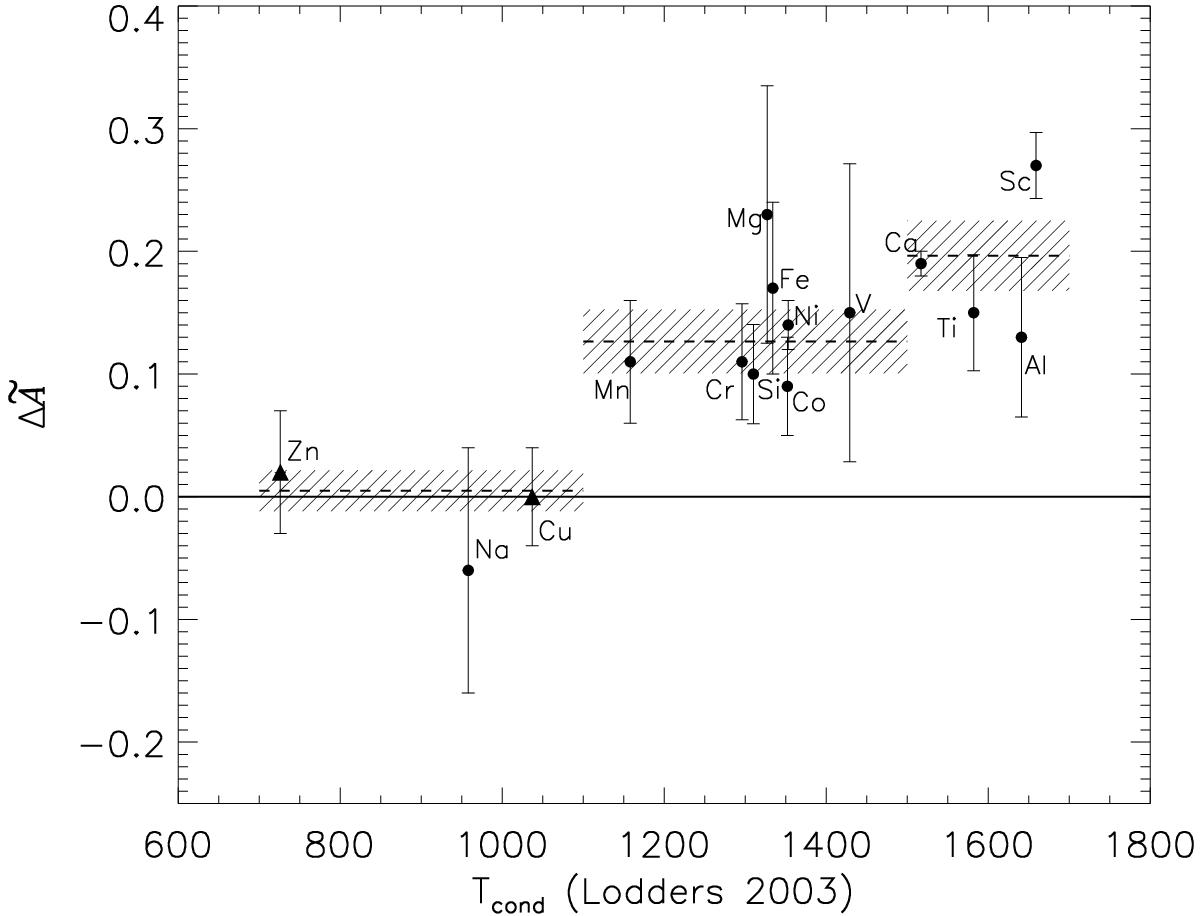
Differential abundances of #52 and #45 as a function of the condensation temperature. The plotted ΔÃ values are those reported in Table 1. The triangles are from Table 2. The condensation temperatures are taken from Lodders (2003). The horizontal dashed lines represent the weighted means of the differential abundances within each class of elements (i.e., volatiles, and moderately and super refractory elements). The bands represent the weighted standard deviation of the mean.
Current usage metrics show cumulative count of Article Views (full-text article views including HTML views, PDF and ePub downloads, according to the available data) and Abstracts Views on Vision4Press platform.
Data correspond to usage on the plateform after 2015. The current usage metrics is available 48-96 hours after online publication and is updated daily on week days.
Initial download of the metrics may take a while.