Free Access
Fig. 3
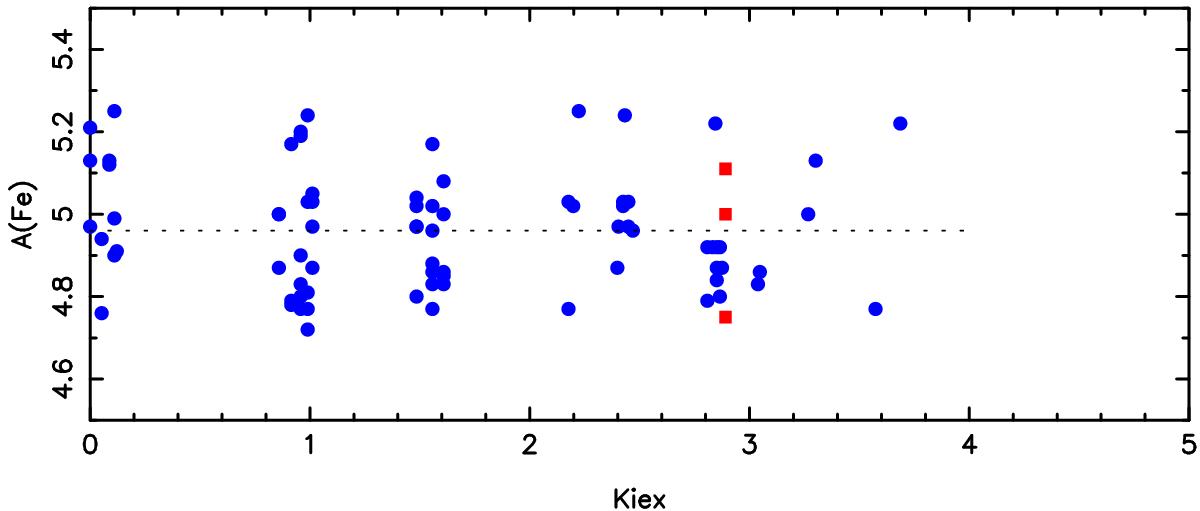
Comparison of the Fe i (blue dots) and Fe ii (red squares) abundances vs. excitation potential for WISE J0725–2351. The adopted model is Teff = 6050 K, log g = 4.2 and vt = 1.5 km s-1. There is no significant trend of the abundance with the excitation potential of the line.
Current usage metrics show cumulative count of Article Views (full-text article views including HTML views, PDF and ePub downloads, according to the available data) and Abstracts Views on Vision4Press platform.
Data correspond to usage on the plateform after 2015. The current usage metrics is available 48-96 hours after online publication and is updated daily on week days.
Initial download of the metrics may take a while.