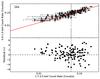
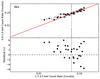
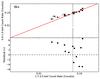
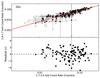
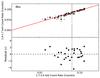
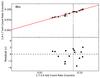
Fig. 2
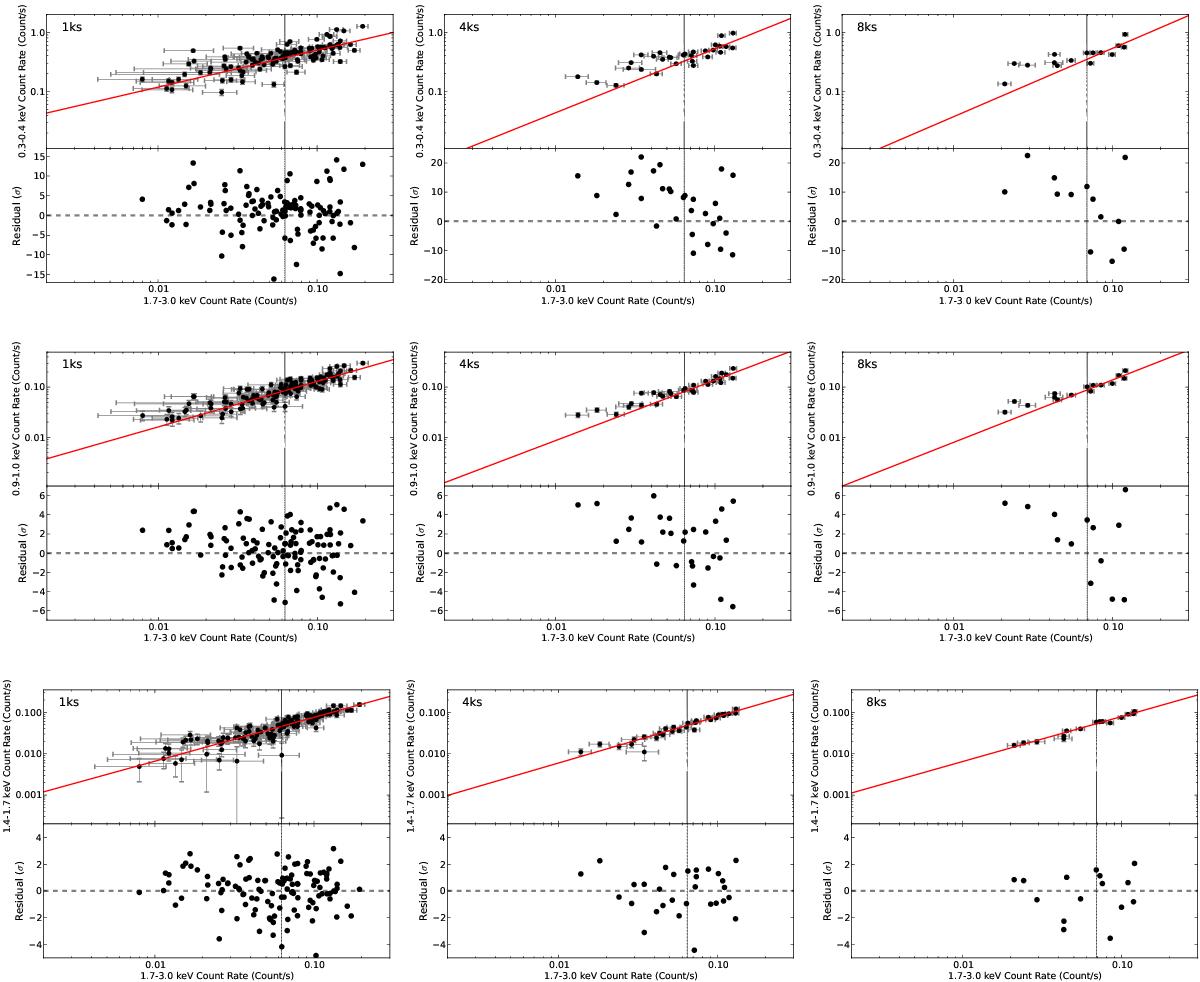
0.3–0.4, 0.9–1, and 1.4–1.7 vs. 1.7–3 keV flux–flux plots (top, middle, and bottom rows, respectively) for Obs. 3, obtained with Δtbin = 1,4, and 8 ks (left, middle, and right columns, respectively). The solid red line indicates the best-fit power-law relation to the “high-flux” data (see text for details). The vertical lines indicate the continuum band median. The best-fit residuals are plotted in the lower plan of each plot. Error bars are omitted in the residual plots for reasons of clarity.
Current usage metrics show cumulative count of Article Views (full-text article views including HTML views, PDF and ePub downloads, according to the available data) and Abstracts Views on Vision4Press platform.
Data correspond to usage on the plateform after 2015. The current usage metrics is available 48-96 hours after online publication and is updated daily on week days.
Initial download of the metrics may take a while.