Fig. 4
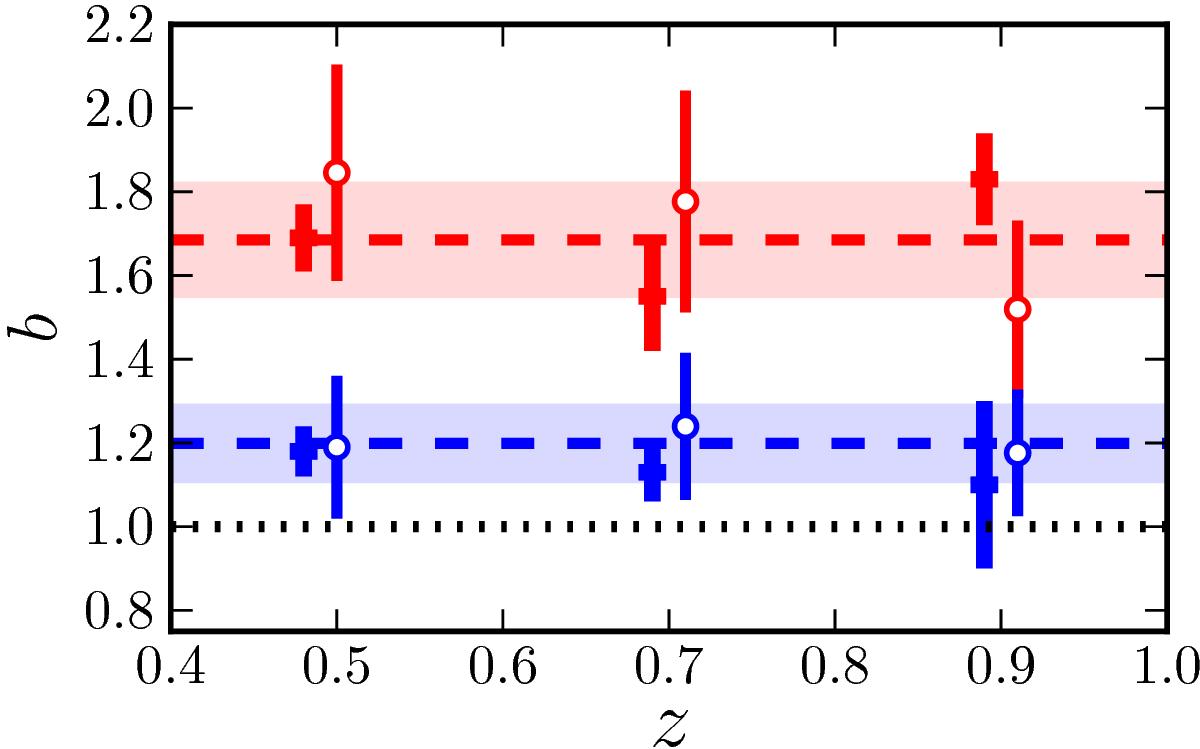
Galaxy bias b of E/S0 (red symbols) and S/SB (blue symbols) galaxies with ![]() as a function of redshift. The dots are from this work by cosmic variance analysis, bv. The crosses are from Hurtado-Gil et al. (2015) by two-point correlation function analysis, bξ. The dashed lines and the coloured areas mark the error-weighted average of bv and its error, respectively, for red (
as a function of redshift. The dots are from this work by cosmic variance analysis, bv. The crosses are from Hurtado-Gil et al. (2015) by two-point correlation function analysis, bξ. The dashed lines and the coloured areas mark the error-weighted average of bv and its error, respectively, for red (![]() ) and blue (
) and blue (![]() ) galaxies. The dotted line marks unity. A colour version of this plot is available in the electronic edition.
) galaxies. The dotted line marks unity. A colour version of this plot is available in the electronic edition.
Current usage metrics show cumulative count of Article Views (full-text article views including HTML views, PDF and ePub downloads, according to the available data) and Abstracts Views on Vision4Press platform.
Data correspond to usage on the plateform after 2015. The current usage metrics is available 48-96 hours after online publication and is updated daily on week days.
Initial download of the metrics may take a while.